July 9, 2020

Nanaimo Market Statistics June 2020

Nanaimo Records Second Highest Single-Family Sales Volume in More Than 2 Years 

The month of June saw BC move into Phase 3 of the province’s restart plan. Dating back to the early stages of 2020 before the COVID-19 related economic lockdown, there was reason for optimism in the Nanaimo real estate market. Some of the optimism certainly materialized in June, with a significant spike in sales volume, and early July conditions remain much the same. With the flurry of activity slightly reminiscent of 2016 - 2017 market conditions, there are Realtors out there who have a very bullish outlook on Nanaimo’s real estate market. As much as we hope they are right, that COVID-19 is now largely a distant memory and it is upwards and onwards, our outlook remains cautious, as it is our belief that the economic impact of the slowdown will ultimately be significantly greater than many are recognizing and that there is a reasonable likelihood that much of the economic pain is still to come, even more likely if the second wave materializes some time later this year. While none of us have a crystal ball, and outside of Ottawa, none of us have a money-printing machine to try to counteract natural economic forces, we certainly cannot make any concrete predictions about what is to come. However, we continue to believe that it is important to report on what has occurred in the market and put our best foot forward interpreting how market conditions may (and I caution “may”) shed some light on what may be to come as we collectively try to emerge from this unexpected event.  

Single Family Price and Volume

131 single-family homes sold in June, up 87% from the 70 that sold in May, and 19% more than the 110 that sold in June of last year. The average sale price increased by 0.53% to $581,603 from $578,514 in May, which is down -0.11% from June of last year when the average sale price was $582,272*.  The median sale price decreased by 1.8% from $565,000 in May to $555,000, which is 3.5% less than the same time frame last year when the median sale price was $574,888. 195 homes were listed in June, which was 22% more than the 160 homes listed in May, and 3% more than the 190 listed in June of 2019.

Insights: In the last 2 years, only May of 2019 saw a higher number of single-family homes sell than June of 2020. If you have been following our commentary, you may remember us commenting in months past that we don’t necessarily see sales volume rebounding immediately as restrictions lift, suggesting we subscribe to the theory that a well supported economic recovery will take some time. Looking at June’s sales figures alone and especially when comparing against the  55 sales in April, 70 sales in May, and even the 112 sales in June of last year, it appears we may have missed the mark on this call. While we hope this is the case, it is important to caution that 1 month doesn’t make a market. It is also important to mention that the 131 sales is 53 less than the 184 homes that sold in June of 2017, 73 less than the 204 that sold in June of 2016, and 36 less than the 167 that sold in June of 2015. While industry sentiment seems to be suggesting that conditions are similar to the boom times of 2015 - 2017, the sales figures suggest otherwise, as June sales volume was still more than 15% below the previous 5-year average figure of 155. 

Another interesting observation is that while sales volume increased 87% from May, the average sale price was essentially flat, up .53%. Compared to last year, this was a .11% decrease, and June is a month that typically sees noticeable year-over-year increases on the heels of the momentum in the spring market. Looking back at the past number of years, June of 2016 was up 17.36% from June of 2015, June of 2017 was up 12.87% from the previous year, and June of 2018 and 2019 saw average year-over-year average price increases of 5.76% and 4.21%, respectively. If you want to throw some more water on the market recovery celebration, it is probably appropriate to mention that the median price actually dropped 1.7% from May, and was down 3.5% from last year, suggesting that while average prices are seeing minimal movement despite negative economic conditions stemming from the COVID shutdown, there may actually be a bit more downward pressure on pricing that can be readily observed strictly by relying on the average sale price, as for June at least, proportionately more homes were selling at higher price points, which was helping to keep the average sales price from dipping too deeply into negative territory. 

Before moving on, I want to acknowledge that my household income (with 2 of us in the business) is largely tied to real estate market conditions, and therefore with full transparency, I have a vested interest in a positive market outlook. It is not our intention to be the dark cloud constantly reporting a negative outlook, but rather to provide an alternative perspective to that of the majority of realtors and industry pundits who may be happy to simply report that the market is on fire with volume up 87% and you have to act now to avoid disappointment. 

So how exactly do market conditions project out moving forward? While there are so many variables at work here including the looming threat of a second wave of COVID that could lock down the economy this fall and winter, it is difficult to predict with any degree of confidence what is likely to materialize near term. Needless to say, if there is not a second wave of COVID, the market outlook is certainly much more positive than it would be if we do see a major rebound and subsequent lockdown. 

There are so many unanswered questions about how the government would respond to a second wave. Certainly, they can’t continue to dole out billions and billions indefinitely. What if COVID isn’t under control in 1 year, 2 years, or beyond, do the support payments, wage subsidies, etc., continue? How can they? What about banks...The 6-month mortgage deferral period which is widely believed to have been taken advantage of by at least 15% of borrowers will end as we transition into fall, the time when many in the health care profession are fearing we could see a second wave of COVID. Will banks continue to offer extended deferrals? Unlikely… Evan Siddall, the head of CMHC has warned of  “a looming mortgage “deferral cliff” this fall” when those still unemployed or still feeling the COVID impact on their household finances have to resume mortgage payments. How about those who have bought cars, RVs, boats, on 6-month no payment plans? There is a good percentage of Canadian households who are redlining it so tightly, that any additional payments are going to be a challenge to manage, and that is before you factor in impending job losses if there is a major second wave of COVID. 

Assuming there is no second wave, the COVID slowdown has been the most negative economic event that many of us have ever lived through and while the “band-aid” solutions and government handouts have done a decent job of delaying the pain, it is our take that the full impacts have still not been realized, eg. If you have not had a mortgage payment for the past 3-months, your household financial picture may be temporarily more manageable than it was pre-COVID. At the time of writing 8.16 million applicants had submitted 18.67 million applications for CERB Benefits, suggesting a substantial percentage of the working population have had their incomes significantly impacted by the pandemic. At some stage, there will be a financial reckoning. It may not be next month or even next year, but all of this money the government has doled out is not government funds, it has been borrowed from the future earnings of taxpayers, which we suspect may include an attempt to ultimately eliminate or at least reduce the exemption on the gains from the sales of our principal residences. Stay tuned on this…

While there is no clear picture of what is to come, looking at factors impacting supply and demand is likely a good place to start in trying to formulate an idea of how pricing may be impacted. From a demand perspective, ask yourself, are we more likely to have more demand or less demand whenever the current situation ends? We are not talking about the desire to purchase, we are talking about demand from those qualified financially to purchase. From our perspective, the more jobs that are lost and businesses that see their temporary closures become permanent closures, the more people who eat into their down payment funds just to pay the bills, the more credit is utilized, all of this points to reduced buyer demand. If there are not enough buyers for the volume of homes for sale (which could very well increase substantially with so many intending to sell holding off), that is when we start to see motivated sellers start to drop their prices, and prices will ultimately adjust until they reach the point of equilibrium where demand equals supply. From the supply side, ask yourself the same question? Are we likely to have more supply or less supply a number of months from now? The difference between demand and supply is that despite intentions, demand can be eliminated beyond the control of the intended buyer due to factors such as job loss or a reduction of downpayment. The supply side is not affected in such a way. If a seller wants to sell, they can list their property. Fear of declining values in the future or reports of declining values (if this does occur) may prompt owners to list, increasing supply. Supply and demand considerations are certainly something we’ll be monitoring closely, and we will be doing so not just considering the overall market, but demand and supply at different price points, in different neighbourhoods, and for different categories of real estate. 

On a more positive note, it is important to realize that Central Vancouver Island remains a retirement destination of choice for many Canadians from across the country, so from a demand perspective, this helps offset some of the lost demand from those who are unable to qualify for financing. With demographics what they are, this should help the area to weather the storm better than other regions in Canada, but to what extent remains largely unknown. 

Other Island Communities - Single Family Price and Volume

So how did Nanaimo stack up against other Island communities north of Victoria for the month of June? Looking at the average price of a single-family home, both Nanaimo and Campbell River were essentially flat,  while Port Alberni/West Coast saw the steepest decline at 16%.  All other communities experienced increases: Cowichan Valley 8%, Parksville/Qualicum 12%, and Comox Valley up 16%.

Looking at sales volume in comparison to last June, only Campbell River and Cowichan Valley experienced declines in volume, -2% and -18% respectively, while all other areas saw increases:  Nanaimo up 19%, Comox Valley 35%, Parksville/Qualicum 38%, and Port Alberni/West Coast experiencing the greatest increase at 68%.   

Looking at the entire Vancouver Island Real Estate Board totals, the average sale price increased 4%, and sales volume overall increased by 18% from June of 2019. 

Insights: The overall increase in sales volume and average sale price is certainly a positive sign. 

Notably, the Parksville/Qualicum market had a strong showing, continuing to benefit from the strong demographic driven demand from baby boomers looking to retire in the area. Taking a drive through this area, you will notice that proportionately there is a much higher percentage of ground-oriented housing, suggesting builders in the past number of years have possibly done a better job of catering to the housing needs of the aging population as opposed to simply looking to maximize profits, which has to some extent occurred in surrounding communities. While it is costlier per sqft to build ground-oriented residences, taking the long view has really positioned savvy Oceanside developers to reap the rewards of increased demand and with it, the upward pressure on pricing, as this region continues to post the highest average sales prices north of Victoria on Vancouver Island. 

Strength of the Trend

Factors we also look at when analyzing a market to validate its strength are the sell/list ratio; sell price; days to sell, and current inventory numbers:

The sell/list ratio increased to 67% in June, up from 44% in May, and from 58% in June of 2019.

The average sell price/list price was 98% in June, no change from May 2020 but up 1% from the same time frame last year. 

The average days on the market for the homes that did sell in June was 29 days, up 11.5% from 26 days in May, but down 3% from June of last year when average days on market was 30.

As of the end of June, the number of active listings was 300, down 3.5% from May’s 311 active listings, and 23.5% lower than the same time last year when there were 392 active listings at month-end.

Insights: Of the 8 market indicators we look at in this section, 6 improved, 1 deteriorated, and 1 remained unchanged. While this certainly appears to be positive, it is important to remember that last month wasn't exactly a banner month, so while statistics improved, the baseline was fairly weak. 

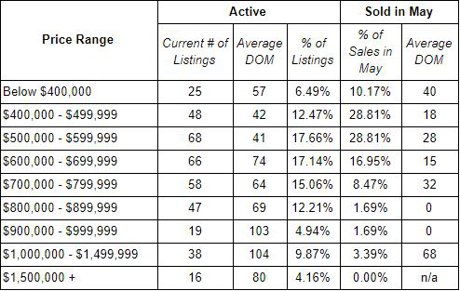
The sell/list ratio rising to 67% is quite bullish. We will be watching for follow-through here, especially if listing numbers remain lower than normal. June’s ending inventory of 300 homes on the market was lower than the end of June figures for any of the preceding 5 years. Continued strength in the sell/list ratio is an indicator that there may be upward pressure on pricing in certain price ranges. What is important to remember here is that these ratios cannot be taken as indicative of homes in all price ranges. For example, there were 24 homes listed in Nanaimo for over $1,000,000 in June, with only 1 sale. Further, there are currently 67 homes on the market in Nanaimo with 7-figure price tags. Clearly the sell/list ratio of 67% is not reflective of the million-plus price range. If you are considering listing your home, talk to a trusted Real Estate professional about market action in your price range before deciding to list, as it will vary significantly by price range. 

The sell price to list price ticked up 1 point from last June, while holding steady from last month at 98%. Not much to comment on here, other than to say that this only factors in the homes that sold, not the 300 active listings on the market at month’s end that hadn’t yet sold. 98% is a solid number, but it is important to remember that it doesn’t factor in any price reductions that preceded the offer, as this figure is based on the last listed price before the offer. 

By historical standards, average days on the market of 29 days is still quite respectable. While this does only factor in the homes that sold, it suggests that attractive offerings that are priced right are still selling quickly in many cases, especially at the lower end of the market. This is consistent with our team’s experience of continuing to be involved in a number of multiple offer situations for recently listed homes. 

Despite the number of new listings in June exceeding the figures for the previous month and June of last year, June’s ending inventory was lower than both May’s and last June. This is likely the result of some pent up buyer demand as COVID restrictions began to list. It will be interesting to see where inventory numbers go from here. Will we see more listings as those who were holding off on listing due to COVID decide to take their homes to market? Will those fearing a second wave and seeing some market strength be pushing to get their homes listed before it is too late? Only time will tell, but it is important to acknowledge that inventory levels are a key factor in driving price action. Lots of demand and a limited number of listings sets the stage for upward pressure on pricing. Limited demand and lots of choice, as we are seeing in the $1,000,000 plus range, will eventually lead to downward pressure on pricing. Similar to our comments about the sell/list price varying by price range, inventory levels and therefore the number of options a buyer has in their price range does as well. With this being the case, it is important to really focus on the segment of the market you are looking to buy or sell into, to help determine if the timing is right.  

Top Performing Neighbourhoods & Categories

11 of the 18 sub-areas defined by the real estate board in Nanaimo saw an increase in the average selling price (trailing 12 months) from May to June, with 13 of the 18 also experiencing increased prices year-over-year. When looking at these neighbourhood figures, it is important to note that we use trailing 12-month figures to limit volatility caused by lower transaction volumes in some neighbourhoods, where a few high priced or low priced transactions could tremendously skew results. A trailing 12 figure will always be slower to react than simple month-over-month, so that is why the results here are not going to be as pronounced as the figures used in the stats we report above. 

Moving on, these year-over-year average price changes range from -12.17% in North Jinglepot to 24.70% in Extension.  The top risers month-over-month were Lower Lantzville, Upper Lantzville, and North Jingle Pot.  Top performers year-over-year were Extension, Upper Lantzville, Lower Lantzville, and Cedar. Looking at volume, 9 of the 18 sub-areas saw increases month-over-month, with Brechin Hill and North Jingle Pot topping the charts at 33.33% and 31.58% respectively, while only 4 of the 18 sub-areas also saw increases year-over-year on a trailing-12 month basis, with the Chase River the top riser in this respect.

Insights: The only noticeable trend is that most of the top-performing sub-areas here for both price and volume are located towards the outskirts of town, where larger properties are more prominent.  It is likely too early to suggest that increased demand for larger properties is resulting from more people exiting the urban life and social distancing considerations, but stay tuned, this will become a talking point in the industry in months to come.  

Lots, townhouses, apartment-style condos, and single-family homes were the categories that saw an increase in average sale price from May to June, with single-family homes and single-family water homes (the latter on very low volume with only 1 sale recorded) the only categories to see increases year-over-year.  Single-family water homes and townhouses were the only categories that did not report month-over-month increases in sales volume, with only single-family homes and apartment-style condos also posting year-over-year increases.

Insights: Not much to read into here. Some categories were up, some were down. Not surprisingly, volume was up for most categories over May, when sales levels were down significantly.

Opportunities 

As the economy continues to emerge from the nightmare that was COVID-19, undoubtedly prospective Buyers and Sellers will have questions about what it means for them. Is now a good time to buy? Is now a good time to sell? The reality is there are no broad strokes answers to this, as any generalizations would be foolish. More so than ever, it is really dependent on what you are looking to buy or sell, where it is, what price range, etc. All of the data provided earlier in this report is based on amalgamated data provided by the real estate board for the single-family homes category in Nanaimo, and while it provides a general idea of how the market is performing, it certainly doesn’t tell the whole story. While we are looking at 1 category - single family, in a single geographic location - Nanaimo, you will see that there are huge variances in market conditions and market action in different price ranges. You could do a similar micro-analysis of neighbourhoods, communities, style of homes, age of homes, the list goes on and on. The important thing to note is that you can’t rely on the headlines or averages as a credible source to make decisions. You need to dig further. As we emerge from this economic shock, if you are considering listing or purchasing, please make sure you are working with a Realtor that has the knowledge and expertise to navigate the market and understands market conditions for the specific category of real estate you are looking to transact in.

On the buy side, as we mentioned earlier in this recap, market conditions at the higher end of the market remain at a near standstill. At the time of writing (July 7th), there were 67 homes on the market above $1,000,000 and only 1 registered sale so far for June. With new listings added to the mix in June, as inventory levels continue to climb, some “deals” are bound to be had, as sellers reduce their pricing to set position their homes ahead of the competition. Similarly, as inventory levels and days on the market continue to rise, motivated sellers are more likely increasingly becoming more and more open to negotiating. If you have been thinking about either upsizing in the local market or moving from the mainland in the coming years, and are targeting an acreage estate, larger executive home, or even your waterfront dream home, you may find with the minimal activity in the higher price range, that there is a window of time that may better position you to enter the higher end of the market, than what we are likely to see as the general economy further recovers from the COVID-19 driven economic slowdown, and this window closes.  

Largely due to the demographics of the local population, for the past few months throughout the COVID-19 slowdown, we have continued to assert our position that homes under $600k and suited homes under $700k are well-positioned to weather the COVID-19 related storm much better than homes priced higher, where there is such a small percentage of our population that have the qualifying income to afford these higher-priced homes. These homes also appear to represent good value to lower mainland based buyers, who continue to add strength to the underlying demand. So far, our take has been pretty much spot on, as demand exceeding supply for quality homes under $600k and suited homes under $700k has resulted in competition and in some areas, upward pressure on pricing. While there is always the macro-market effect, where the overall real estate market on a larger scale, such as BC, or even Canada will be impacted by various factors such as monetary and fiscal policy, government intervention, etc., we continue to believe that values of homes at the mid to lower end of the market will not be impacted too significantly, if at all, by the current economic slowdown. Of course, this is subject to change as we continue to monitor the market. If COVID-19 comes back for a second and third wave and 2 years from now we are still looking at significant unemployment numbers and a weak economic picture, our outlook would likely be more cautious for this category. 

So, for sellers, if you have a home under $600k or suited homes under $700k and you need to sell, you are in a good position to attract a buyer if you need to exit. At higher price points, if you have an exceptional offering and need to exit, you have a chance. Otherwise, if time is on your side and you are listing at the higher end of the market, you may be best served by waiting on the sidelines for more robust buyer demand in your price range. The challenge here is timing, as we don’t know how long it will take for conditions to improve. What we do know is historically markets are cyclical and there will likely be a better time to exit ahead, it could just be 2, 3, 5, 10 years out. 

An important point here is that sellers need to factor in their next move to the equation. If you are looking to sell your $800,000, 3,000+ sqft. home to buy a ground-level, seniors oriented home in the $500k - $600k range, then you may want to consider pulling the trigger, as demographic driven demand for those types of homes from those across Canada choosing Central Vancouver Island as their retirement destination of choice may put significant upward pressure on prices for that type of home, which could negate any potential benefit of holding off on selling until market conditions are stronger at higher price points. Another scenario that we also think makes sense right now is for those looking to upsize. If you can sell your $600,000 home into strength, and purchase at a higher price point where market conditions are much softer, you may find significant additional value relative to the actual step-up in price, and get a great deal in the process. Again, there is likely a window here, that as the economy recovers may start to close for an upsizing market. As each individual or family’s circumstances are different, no matter what your scenario is, working with a realtor taking an advisory approach and focusing on lifestyle by design will go a long way in helping you determine the best way to achieve your real estate related goals.  

For investors, with us, it always gets back to the numbers. Downside protection is every bit as important as speculating on appreciation. Values so far have not been significantly impacted, especially at the lower end of the market. With much uncertainty persisting, purchasing right now represents increased risk that you could find yourself in a situation in the coming months with a property that has a value lower than when you purchased it. This makes it more important than ever that any investments are cash flow positive and achieve an acceptable rate of return because if you acquire a negative cash flow property, your only guarantee in the short-run is the property will be costing you money. If you do come across an investment opportunity where the numbers do work well and you are a long-term investor and are comfortable assuming the risks that in the short term there is a reasonable probability that we could see the average home values fall, then maybe you don’t want to rule out a purchase this year. The reality, unfortunately, is that mass economic slowdowns create financial hardship, which inevitably at some stage will likely result in some good buying opportunities for those watching closely. We believe on the buy side, patience is likely going to be rewarded. Remember, much of your ultimate return is derived from your entry point, the price you were able to purchase at. Right now sub-$700k, most homes are still being listed at all-time highs. So, for most investors, stay safe, educate yourself on the local market, be patient, watch out for deals if and when they emerge, make sure you are running the numbers, and if the numbers work, be ready to act. In this regard, don’t be shy to reach out and get the conversation going with a good investment-focused realtor. They are here to help.

Remember, over time real estate generally appreciates. We just know there are peaks and valleys. Buy on the way to the peak and you are positioning yourself for success, buy on the way to the valley, not so much, at least in a short-to-medium timeframe. As the impact of the COVID-19 related slowdown on the economy continues to unfold, right now we have reason to believe that the overall economy and macro-market conditions for real estate may be more likely on the way to a valley or stuck in the valley than on an upward ascent to the peak, but only time will tell.  It is our mandate to provide you with information that you can use to determine which side of the peak we are on, and ultimately to help you make informed decisions that you will not regret. 

Above all else, continue to stay safe, we wish you and all those close to you the best of health and an enjoyable summer!

For a consultation specific to your situation, or if you have any questions about market conditions, please contact us at info@jahelkagroup.com and we would be happy to help.

Check out the Nanaimo Market Statistics Here:  Market Stats June 2020

Source: VIREB

*In July 2019, VIREB published, and we subsequently reported at that time, that the average sell price/unit for a single-family home in Nanaimo in June 2019 was $580,330 however VIREB has since revised this figure and now reports an average sell price/unit of $582,272 for June 2019.

Disclaimer: The information presented is intended for general information purposes only and should not be construed as Real Estate advice. Each client's situation is unique and therefore we recommend consulting directly with your professional advisors (Realtor, Accountant, Lawyer, Investment Advisor, etc.) prior to making any real estate decisions. Not intended to induce breach of an existing agency agreement or solicit properties currently listed for sale or individuals currently under contract with a Brokerage.


June 4, 2020

Nanaimo Market Statistics May 2020


COVID-19 Continues To Slow Sales Volume in May


The month of May saw us move into Phase 2 of the province’s restart plan which certainly represents a few steps in the right direction for the economy and our sanity, however, the world we knew just a few short months ago still seems like a distant memory. Dating back to the early stages of 2020 before the COVID-19 related economic lockdown, there was reason for optimism in the Nanaimo real estate market. With the gradual re-opening of the economy, there are realtors who are starting to sing a more optimistic tune about Nanaimo’s market conditions, however as much as we hope they are right and COVID-19 is now largely a distant memory and it is upwards and onwards, our outlook remains cautious, as it is our belief that the economic impact of the slowdown will ultimately be significantly greater than many are recognizing and that there is a fairly strong likelihood that much of the economic pain is still to come, even more likely if the second wave materializes some time later this year. While none of us have a crystal ball, and outside of Ottawa, none of us have a money-printing machine to try to counteract natural economic forces, we certainly cannot make any concrete predictions about what is to come. However, we continue to believe that it is important to report on what has occurred in the market and put our best foot forward interpreting how market conditions may (and I caution “may”) shed some light on what may be to come as we collectively try to emerge from this unexpected event.  

Single Family Price and Volume

70 single-family homes sold in May, up 27% from the 55 that sold in April, but 49% less than the 136 that sold in May of last year. The average sale price decreased to $578,514, down 2.5% from $593,503 in April and from $593,326 in May of last year. The median sale price decreased by 0.53% from $568,000 in April to $565,000, which is 1.7% less than the same time frame last year when the median sale price was $575,000. 160 homes were listed in May, which was 65% more than the 97 homes listed in April, but 33% less than the 240 listed in May of 2019. 

Insights: Despite the number of homes sold increasing from last month, on the heels of April’s 47% decrease in sales volume over April of 2019, May sales volume was down 49%, undoubtedly suggesting the COVID-19 related economic slowdown continued to significantly impact market activity.  At the time of writing 8.37 million applicants had submitted 15.32 million applications for CERB Benefits, suggesting a substantial percentage of the working population have had their incomes significantly impacted by the pandemic. While the optimist may be quick to suggest that it was the social distancing measures in place that has continued to slow sales volume, the realist would counter that for most Canadians the purchase of a home isn’t possible without some form of financing, and mortgage qualification requires meeting minimum income requirements and down payment requirements. For those who have lost their job, their income has been reduced, or they have had to eat into their down payment to keep up with mounting bills, if they had intended to purchase in the near future, it is now no longer a possibility. As the weeks tick by and businesses adapt their business models and realize less on-site staff are required or businesses that intended to only close temporarily realize they will be unable to re-open, the likelihood of these layoffs originally intended to be “temporary” becoming permanent only increases. For those folks still working whose income is variable or whose hours have been reduced, you have to think that increased credit utilization to cover the bills is going to impact qualification amounts for those looking to buy in the months and years to come. For all those who were previously subscribing to the “light switch” theory, eg., when the government lifts restrictions this market is going to take off due to all of the pent up demand, we continue to see that as extremely unlikely, as it appears restrictions will be lifted gradually, and the mid-May step into Phase 2 appears to have had a minimal impact on increasing sales volume, relative to April’s numbers where the economy was essentially in full lockdown mode. 

What are we getting at? We are not expecting a V-shaped recovery on sales volume. The economy will recover, it always does, but a sustained, well supported economic recovery will take some time. Those who have lost employment need to find new jobs. Those who have spent their down payment or used credit to pay the bills during the slowdown will need to get their financial affairs back in order before heading out house shopping. Looking at the last market cycle, in 2007, the year preceding the 2008 Financial Crisis, Nanaimo had 1702 single family homes sell. In 2008, sales volume dropped to 1174, representing a 31% decline. Over the next 5 years, the market remained subdued, averaging 1136 sales as our local economy slowly recovered and rebuilt, setting the stage for the 2014-2017 major run-up in sales volume and average sale prices. What happened to prices over that 5 year period (2009 - 2013) you ask? At an average of $356,722 the average sale price was actually lower than the average of $363,985 which was the cycle high in 2008, the year following the sales volume cycle high.

But that was then, and this is now, what is happening and what do you see happening with average prices moving forward? Since reaching the all-time high average price for Nanaimo in January of this year (on lower volume) at $603,720, the average price has declined 4.2%. Had it not been for COVID, we wouldn’t have read much into this fluctuation, as for the past 2 years after the strong run-up in the years that preceded it, the average price had largely been range-bound between $550k - $600k. However, we have to wonder if this could possibly be the first stage of a larger move downwards, driven by reduced buyer demand based on fewer financial qualifications and a more cautious stance prioritizing saving overspending. Economic confidence has certainly been shaken, for some more than others, and only time will tell how long it will take to rebuild. 

The other important consideration is that you can’t look at the market categorically - whether that be by asset class, such as “single-family homes”, geographically, such as the “Nanaimo market”, and paint the picture with broad strokes. There are categories within categories. Our group had been involved in possibly more multiple-offer situations than not on a variety of asset classes with listings priced under $600,000. Why is this? Demand remains strong for solid options priced below $600,000 because this is what the majority of the population of Nanaimo can afford. We continue to believe that for the foreseeable future, the higher end of the market at large will continue to face headwinds due to an oversupply and lack of demand. When will this change? When we have sustained out-of-town buying where buyers have the financial means to sustainably absorb the volume of higher-priced homes that the downsizing baby boomers are hoping to unload. 

So how exactly does this project moving forward? While there are so many variables at work here, it is difficult to predict, looking at factors impacting supply and demand as touched on above is likely a good place to start in trying to formulate an idea of how pricing may be impacted. From a demand perspective, ask yourself, are we more likely to have more demand or less demand whenever the current situation ends? Remember, real estate trading services were deemed an essential service, so all those who were extremely motivated and qualified to buy have been doing so. From our perspective, the longer this drags out, the more jobs that are lost and businesses that see their temporary closures become permanent closures, the more people who eat into their down payment funds just to pay the bills, the more credit is utilized, all of this points to reduced buyer demand. If there are not enough buyers for the volume of homes for sale (which could very well increase substantially with so many intending to sell holding off), that is when we start to see motivated sellers start to drop their prices, and prices will ultimately adjust until they reach the point of equilibrium where demand equals supply. From the supply side, ask yourself the same question? Are we likely to have more supply or less supply a number of months from now? The difference between demand and supply is that despite intentions, demand can be eliminated beyond the control of the intended buyer due to factors such as job loss or a reduction of downpayment. The supply side is not affected in such a way. If a seller wants to sell, they can list their property. Fear of declining values in the future or reports of declining values (if this does occur) may prompt owners to list, increasing supply. Supply and demand considerations are certainly something we’ll be monitoring closely, and we will be doing so not just considering the overall market, but demand and supply at different price points, in different neighbourhoods, and for different categories of real estate.

Other Island Communities - Single Family Price and Volume

So how did Nanaimo stack up against other Island communities north of Victoria for the month of May? Looking at the average price of a single-family home, Nanaimo was actually the only area that saw a reduction in the average single-family home price to the tune of -2%, with all other communities experiencing increases: Cowichan Valley up 5%, Port Alberni/West Coast and Comox Valley both up 7% year-over-year, Campbell River up 9%, and Parksville/Qualicum seeing the highest increase at 18%.

Looking at sales volume in comparison to last May, once again, all communities experienced reductions in volume:  Cowichan Valley saw the lowest decline at -5% while all other areas saw more substantial decreases, Port Alberni/West Coast -37%, Nanaimo -49%, Comox Valley -57%, Parksville/Qualicum -59%, and Campbell River experiencing the steepest decline, down 62%.  

Looking at the entire Vancouver Island Real Estate Board totals, the average sale price increased 5%, and sales volume overall declined by 46% from May of 2019. 

Insights: The increasing average prices outside of Nanaimo are certainly positive, however, it is somewhat tempered by the significant decrease in volume. Parksville/Qualicum is an interesting example with average sales prices up 18% over last May, but sales volume down 59% compared to the same period.  Outside of Nanaimo, Parksville/Qualicum is the market we watch closest, followed by the Cowichan Valley, as many of our out-of-town buyers see their original search parameters stretch from Qualicum Beach south to the Cowichan Valley, and Parksville Qualicum as Canada’s premier retirement destination serves as somewhat of an informal gauge on demand for lifestyle moves to the Island. The average price increase is certainly viewed positively, the volume decreases not so much… With this being the case, we will be continuing to monitor this market closely in the months to come and continue to report on possible implications for our market based on out-of-town buyer demand. 

Strength of the Trend

Factors we also look at when analyzing a market to validate its strength are the sell/list ratio; sell price; days to sell, and current inventory numbers:

The sell/list ratio decreased to 44% in May, down from 57% both last month and in May of 2019.

The average sell price/list price was 98% in May, up 1% from April but no change from the same time frame last year.

The average days on the market for the homes that did sell in May was 26 days, up 8% from both last month and May of last year when the average days on market was 24.

As of the end of May, the number of active listings was 311, up 14% from April’s 272 active listings, but 18% lower than the same time last year when there were 381 active listings at month-end.

Insights: Of the 8 market indicators we look at in this section, 5 deteriorated, 2 improved, and 1 remained unchanged. 

The sell/list ratio decreased to 44%, which all else considered equal is a reasonable figure. However, this is the lowest we have seen in 4 months, and the bigger question, similar to average prices, is whether this is the first step in a more significant move downwards? The number of new listings was down 33% over last May, not as pronounced as the 47% decrease in April over April of 2019. Assuming COVID restrictions continue to lift, what is important to remember is that financial challenges or even distress will not prevent people from listing, in fact, it may drive people to list their homes. Financial challenges will however prevent people from qualifying for mortgages or limit their qualification amounts if they do. Translation - it is a very real possibility that we see the sell/list ratio continue to decline, which will serve as an indicator that there is downward pressure on pricing, at least in some price ranges or categories. 

The sell price to list price ticked up 1 point from last month, while holding steady from last May at 98%. Not much to comment on here, other than to say that this only factors in the homes that sold, not the 311 active listings on the market at month’s end that hadn’t yet sold. 98% is a solid number, but it is important to remember that it doesn’t factor in sellers factoring in a possible COVID impact to their list price, or the price reductions that preceded the offer, as this figure is based on the last listed price before the offer. 

By historical standards, average days on the market of 26 days is still quite low. While this does only factor in the homes that sold, it suggests that attractive offerings that are priced right are still selling quickly in many cases, especially at the lower end of the market. This is consistent with our team’s experience of having been in numerous multiple offer situations for newly listed homes over the past few months, despite the COVID precautions and concerns.

Lastly, the 311 homes on the market at the end of the month was up from last month’s ending inventory of 272. Will we see the number of homes continue to climb? Only time will tell, but if we had to make a call, we would suggest, “yes”.  While there were 70 fewer homes on the market than at the end of May 2019, there were also 80 fewer new listings. While currently there is less supply, there is also less demand. With the economy starting, we will be monitoring inventory numbers closely.  For buyers hoping for a “good deal”, you should be hoping for lots of new listings and lower buyer demand. For sellers hoping the impact on home values is minimal, you should be hoping that most who had intended to list hold off and that both supply and demand begin to increase at a relatively similar pace. This may be the more optimistic outlook, but given the innumerable variables here and the unprecedented level of government intervention, you never know...

Top Performing Neighbourhoods & Categories

7 of the 18 sub-areas defined by the real estate board in Nanaimo saw an increase in the average selling price (trailing 12 months) from April to May, with 12 of the 18 also experiencing increased prices year-over-year. When looking at these neighbourhood figures, it is important to note that we use trailing 12-month figures to limit volatility caused by lower transaction volumes in some neighbourhoods, where a few high priced or low priced transactions could tremendously skew results. A trailing 12 figure will always be slower to react than simple month-over-month, so that is why the results here are not going to be as pronounced as the figures used in the stats we report above. 

Moving on, these year-over-year average price changes range from -14.87% in North Jinglepot to 24.42% in Extension.  The top risers month-over-month were Extension, South Jingle Pot, and Brechin Hill.  Top performers year-over-year were Extension, Upper Lantzville, Cedar, Uplands, and Lower Lantzville. Looking at volume, only 2 of the 18 sub-areas saw increases month-over-month, Lower Lantzville at 11.1% and South Jingle Pot at 8.7%, while 4 of the 18 sub-areas also saw increases year-over-year on a trailing-12 month basis, with the University District the top riser in this respect.

Insights: The only noticeable trend is that most of the top-performing sub-areas here for both price and volume are located towards the outskirts of town. The Extension area for the second month in a row leading the way with price increases both month-over-month and year-over-year is a prime example and may indicate that there are some buyers seeking larger properties. It is likely too early to suggest that increased demand for larger properties is resulting from more people exiting the urban life and social distancing considerations, but stay tuned, this will become a talking point in the industry in months to come.  Another possible explanation for Extension’s average price increases is that as a historically more affordable area, it may be benefiting from demand from those priced out of other neighbourhoods. Upper Lantzville, Lower Lantzville, and Cedar are other top performers where larger properties are more common. Lantzville (Upper and Lower) is often high on the wishlist of buyers’ preferred areas, especially out-of-town buyers.  As expected given overall market figures, volume was down for the vast majority of sub-areas.

Single-family water homes and lots (on low volume - 2 and 1 respectively) and apartment-style condos were the only categories that saw an increase in average sale price from April to May, with single-family water homes and lots the only categories to see increases year-over-year.  Single-family homes and lots were the only categories that did not report month-over-month increases in sales volume, with no categories posting year-over-year increases.

Insights: The low volume of waterfront homes and lots sold above essentially render these monthly average pricing figures useless.  In case you are interested in the impact on sales volume for the various categories, in comparison to last May, sales volume was down 90% for lots, 75% for waterfront homes, 60% for townhomes, 56% for patio homes, and 21% for condos.  

Opportunities

As the economy begins to emerge from the nightmare that was COVID-19, undoubtedly prospective Buyers and Sellers will have questions about what it means for them. Is now a good time to buy? Is now a good time to sell? The reality is there are no broad strokes answers to this, as any generalizations would be foolish. More so than ever, it is really dependent on what you are looking to buy or sell, where it is, what price range, etc. All of the data provided earlier in this report is based on amalgamated data provided by the real estate board for the single-family homes category in Nanaimo, and while it provides a general idea of how the market is performing, it certainly doesn’t tell the whole story. In the interest of your time, we will take a quick look below at this category that we focus most on in our monthly recap - single-family homes - to support this assertion. While we are looking at 1 category - single family, in a single geographic location - Nanaimo, you will see that there are huge variances in market conditions and market action in different price ranges. You could do a similar micro-analysis of neighbourhoods, communities, style of homes, age of homes, the list goes on and on. The important thing to note is that you can’t rely on the headlines or averages as a credible source to make decisions. You need to dig further. As we emerge from this economic shock, if you are considering listing or purchasing, please make sure you are working with a Realtor that has the knowledge and expertise to navigate the market and understands market conditions for the specific category of real estate you are looking to transact in.

Here we go... Let’s first take a look at the active inventory of single-family homes broken down by price category and proportionate share of listings within these categories versus the proportionate share of sales that occurred in May within these categories. 


As you can see, below $600,000 the % of sales in May exceeds the % of listings, between $400k - $600k by a fairly significant margin. The relationship then reverses significantly as prices climb. You will also see looking at active inventory figures that the average Days on Market (DOM) follows a general trend upwards as price increases, suggesting higher price homes are sitting longer on the market. Hold on you say, what about the $800k - $900k range where the average days on market for homes sold in May was zero. That is correct, 1 standout home sold in each category the first day it was listed. There are currently 68 homes on the market in this range, the 2 sales in May imply that at that level of absorption, we currently have nearly 3 years of supply in this range. In other words, if sales were to continue at this pace, it would take nearly 3 years for all of these homes to sell, and that is not factoring in any new listings being added to the equation during this period. Compare this to the $400k - $500k range, where there is currently less than 3 months of supply, and you can see that we are talking about drastically different market conditions depending on the range you are looking to sell or buy in. 

A couple of other surprising statistics about May sales. Firstly, 39% of homes sold at or above the list price. Secondly, 41% of homes that did sell, sold within the first week of being listed (or re-listed). The takeaway here is that quality homes that are accurately priced (mostly below $600k), are still moving quickly and there likely won’t be much room for negotiation. Conversely, the 2 homes that sold above $1,000,000 in May sold for 92% and 95% of the asking price, after 58 and 78 days on the market.

What does all this mean? So far, we are still in very much of a micro-market, where certain pockets of the market could be described as hot, and some could be described as cold. Hot pockets are good for sellers, cold pockets are good for buyers. 

Due to the demographics of the local population, we continue to believe that homes under $600k and suited homes under $700k are well-positioned to weather the COVID-19 related storm much better than homes priced higher, where there is such a small percentage of our population that have the qualifying income to afford these higher-priced homes. These homes also appear to represent good value to lower mainland based buyers, who continue to add strength to the underlying demand. While there is always the macro-market effect, where the overall real estate market on a larger scale, such as BC, or even Canada will be impacted by various factors such as monetary and fiscal policy, government intervention, etc., we don’t see the values of homes at the mid to lower end of the market being impacted too significantly at this stage. Of course, this is subject to change as we continue to monitor the market. If COVID-19 comes back for a second and third wave and 2 years from now we are still looking at significant unemployment numbers and a weak economic picture, our outlook would likely be more cautious for this category. 

The $700k range is largely transitionary, and attractive listings are still selling. Above $800k our outlook isn’t so rosy. Nealy ⅓ of the homes listed in Nanaimo are priced above $800k, yet less than 7% of homes sold in May sold above $800k. While the most attractive options are still selling, eg. the 2 in May that sold the first day on the market, the vast majority of homes in this range are not selling. Eventually, this leads to price concessions, eg. the 92% and 95% of list price sales on the 2 homes over $1,000,000. 

For buyers, as inventory levels mount in the $800k+ range, we see that opportunities are starting to and will continue to emerge, until which time sustained demand emerges for homes in this price range. For buyers waiting for a good deal on homes under $600k and suited homes under $700k, you may be waiting a long time, in fact, we see a very real possibility that you won’t see better value in this price range than we have today, there is simply too much competition driven by household income and financing qualification restrictions of the local population.

For sellers, if you have a home under $600k or suited homes under $700k and you need to sell, you are in a good position to attract a buyer if you need to exit. At higher price points, if you have an exceptional offering and need to exit, you have a chance. Otherwise, if time is on your side, you may be best served by waiting on the sidelines for more robust buyer demand in your price range. The challenge here is timing, as we don’t know how long it will take for conditions to improve. What we do know is historically markets are cyclical and there will likely be a better time to exit ahead, it could just be 2, 3, 5, 10 years out. Sellers also need to factor in their next move to the equation. If you are looking to sell your $800,000, 3,000+ sqft. home to buy a ground-level, seniors oriented home in the $500k - $600k range, then you may want to consider pulling the trigger, as demographic driven demand for those types of homes from those across Canada choosing Central Vancouver Island as their retirement destination of choice may put significant upward pressure on prices for that type of home, which could negate any potential benefit of holding off on selling until market conditions are stronger at higher price points. Again, generalizations are as good as useless. Working with a realtor taking an advisory approach and focusing on lifestyle by design will go a long way in helping you determine the best way to achieve your real estate related goals.

For investors, with us, it always gets back to the numbers. Downside protection is every bit as important as speculating on appreciation. Values so far have not been significantly impacted, especially at the lower end of the market. With much uncertainty persisting, purchasing right now represents increased risk that you could find yourself in a situation in the coming months with a property that has a value lower than when you purchased it. This makes it more important than ever that any investments are cash flow positive and achieve an acceptable rate of return because if you acquire a negative cash flow property, your only guarantee in the short-run is the property will be costing you money. With an increased probability of values declining, buying a property that is costing you money each month, and has a decent chance of losing value (at least short term) doesn’t seem like an overly prudent investment approach. However, if you do come across an investment opportunity where the numbers do work well and you are a long-term investor and are comfortable assuming the risks that in the short term there is a reasonable probability we will see average home values fall, then maybe you don’t want to rule out a purchase this year. The reality, unfortunately, is that mass economic slowdowns create financial hardship, which inevitably at some stage will likely result in some good buying opportunities for those watching closely. While we don’t have a crystal ball, it is our take that things are likely to get worse before they get better, especially if the COVID-19 concerns linger longer than expected, or we have a second wave heading into fall and winter as is increasingly being prepared for. We believe on the buy side, patience is likely going to be rewarded. Remember, much of your ultimate return is derived from your entry point, the price you were able to purchase at. Right now sub-$700k, most homes are still being listed at all-time highs. So, for most investors, stay safe, educate yourself on the local market, be patient, watch out for deals if and when they emerge, make sure you are running the numbers, and if the numbers work, be ready to act. In this regard, don’t feel shy to reach out and get the conversation going with a good investment-focused realtor. They are here to help.

Remember, over time real estate generally appreciates. We just know there are peaks and valleys. Buy on the way to the peak and you are positioning yourself for success, buy on the way to the valley, not so much, at least in a short-to-medium timeframe. Right now we have reason to believe we may be more likely on the way to a valley or stuck in the valley, than on an upward ascent to the peak, but only time will tell.  It is our mandate to provide you with information that you can use to determine which side of the peak we are on, and ultimately to help you make informed decisions that you will not regret. 

Above all else, stay safe, do your part in flattening the curve, and we wish you and all those close to you the best of health!

For a consultation specific to your situation, or if you have any questions about market conditions, please contact us at info@jahelkagroup.com and we would be happy to help.

Check out the Nanaimo Market Statistics Here:  Market Stats May 2020

Source: VIREB


Disclaimer: The information presented is intended for general information purposes only and should not be construed as Real Estate advice. Each client's situation is unique and therefore we recommend consulting directly with your professional advisors (Realtor, Accountant, Lawyer, Investment Advisor, etc.) prior to making any real estate decisions. Not intended to induce breach of an existing agency agreement or solicit properties currently listed for sale or individuals currently under contract with a Brokerage.

May 7, 2020

Nanaimo Market Statistics April 2020

Average Home Prices Hold, Sales Volume Drops Significantly in April  


The COVID-19 pandemic continues to significantly impact the economy, our routines, and all that we knew as normal just a couple of short months ago. As the month of February drew to a close, there was reason for optimism in the Nanaimo real estate market. Given what unfolded in the weeks to follow and the uncertainty that persists about what will occur in the weeks and months to come as the economy begins to reopen, these are certainly unprecedented times, and market sentiment is certainly not where it was earlier this year. As the narrative and expectations for what is to come continue to evolve, making any sort of concrete predictions would be foolish. However, we continue to believe that it is important to report on what has occurred in the market and put our best foot forward interpreting how market conditions may (and I caution “may”) shed some light on what may be to come when the COVID-19 concerns begin to lift. 

Single Family Price and Volume

55 single-family homes sold in April, down 39% from the 90 that sold in March, and 47% less than the 104 that sold in April of last year. The average sale price increased slightly (0.21%), coming in at $593,503, up from $592,262 in March. April’s average sale price was also up by just over 1% from last April when the average sale price was $586,595. The median sale price increased by 0.53% from $565,000 in March to $568,000 in April, which is 2% less than the same time frame last year when the median sale price was $579,900. 97 homes were listed in April, which was 48% less than the 185 homes listed in March, and 47% less than the 184 listed in April of 2019.

Insights: After a surprisingly resilient March that witnessed the onset of the COVID-19 related social distance measures, April activity was hit much harder from a volume perspective. At the time of writing 7.59 million applicants had submitted 11.02 million applications for CERB Benefits, suggesting a substantial percentage of the working population have had their incomes significantly impacted by the pandemic. While the optimist may be quick to suggest that it is the social distancing measures in place that has slowed sales volume, the realist would be quick to point out that for most Canadians the purchase of a home isn’t possible with some form of financing, and mortgage qualification requires meeting minimum income requirements and down payment requirements. For those that have lost their job, their income has been reduced, or they have had to eat into their down payment to keep up with mounting bills, for many who had intended to purchase in the near future, it is no longer a possibility. As the weeks tick by and businesses that had mass “temporary”  layoffs adapt to operating lean and likely more efficiently, the likelihood of these layoffs becoming permanent only increases. Similarly, with each passing week, the probability of businesses that “temporarily” closed reopening only decreases. For those folks still working whose income is variable or whose hours have been reduced, you have to think that increased credit utilization to cover the bills is going to impact qualification amounts for those looking to buy in the months and years to come. For all those who subscribe to the “light switch” theory, eg., when the government lifts restrictions this market is going to take off due to all of the pent up demand, we see that as extremely unlikely. 

But what about prices you ask? So far, pricing seems to be holding up. In fact, we are up marginally both month-over-month and year-over-year. While this is correct, you have to look at the mechanics of pricing and the fact it is driven largely by interaction of buyer demand and seller supply. April saw sales volume fall 47% from April of last year. What is interesting to note is that the number of new listings in April also dropped 47% from April of last year. So what we are seeing in the early stages of the COVID-19 impact is less buyer demand, less seller supply, and prices relatively flat. 

So how does this project moving forward? While there are so many variables at work here, it is difficult to predict, looking at factors impacting supply and demand is likely a good place to start in trying to formulate an idea of how pricing may be impacted. From a demand perspective, ask yourself, are we more likely to have more demand or less demand whenever the current situation ends? Remember, all those extremely motivated and qualified to buy are doing so. From our perspective, the longer this drags out, the more jobs that are lost and businesses that see their temporary closures become permanent closures, the more people who eat into their down payment funds just to pay the bills, the more credit is utilized, all of this points to reduced buyer demand. If there are not enough buyers for the volume of homes for sale (which could very well increase substantially with so many intending to sell holding off), that is when we start to see motivated sellers start to drop their prices, and prices will ultimately adjust until they reach the point of equilibrium where demand equals supply. From the supply side, ask yourself the same question? Are we likely to have more supply or less supply a number of months from now? The difference between demand and supply is that despite intentions, demand can be eliminated beyond the control of the intended buyer due to factors such as job loss or a reduction of downpayment. The supply side is not affected in such a way. If a seller wants to sell, they can list their property. Fear of declining values in the future or reports of declining values (if this does occur) may prompt owners to list, increasing supply. Supply and demand considerations are certainly something we’ll be monitoring closely, and we will be doing so not just considering the overall market, but demand and supply at different price points, in different neighbourhoods, and for different categories of real estate.

So how did Nanaimo stack up against other Island communities north of Victoria for the month of April? Looking at the average price of a single-family home, Nanaimo up 1% year-over-year was eclipsed to the upside by Cowichan Valley and Parksville/Qualicum both up 5%, while Campbell River, Comox Valley, and Port Alberni/West Coast all saw reductions in the average single-family home price to the tune of -7%, -9%, and -11% respectively.

Looking at sales volume in comparison to last April, all communities experienced dramatic reductions in volume:  Cowichan Valley was down 43%, Nanaimo 47%, Campbell River 49%, Comox Valley 56%, and Parksville/Qualicum 69%, with Port Alberni/West Coast experiencing the steepest decline, down 72%.  

Looking at the entire Vancouver Island Real Estate Board totals, the average sale price was down 1%, and sales volume overall declined by 54% from April of 2019. 

Strength of the Trend

Factors we also look at when analyzing a market to validate its strength are the sell/list ratio; sell price; days to sell, and current inventory numbers:

The sell/list ratio increased to 57% in April, up from March’s 49%,  which was no change from April of last year.

The average sell price/list price was 97% in April which represents a 1% decrease from the 98% reported both last month and in the same time frame last year. 

The average days on the market for the homes that did sell in April was 24 days, down 17% from both last month and April of last year when the average days on market was 29.

As of the end of April, the number of active listings was 272, down 6% from March’s 288 active listings, and 19% lower than the same time last year when there were 336 active listings at month-end.

Insights: Of the 8 market indicators we look at in this section, 5 improved, 2 deteriorated, and 1 remained unchanged. 

The sell/list ratio at 57% up from March and consistent with last April’s figure is a positive sign, but as discussed above, both demand and supply so far have been reduced, and the market in April likely benefited significantly from the motivated buyers who may have sold or accepted a job transfer to the area pre-COVID-19, or otherwise needed to find a place with some degree of urgency. As we get deeper into the economic hibernation this urgent demand is increasingly being satisfied, and buyers without time constraints may be more likely to wait for more supply or to see prices decline in the coming months. With talk of some of the restrictions in BC possibly starting to be reduced later in May, a decent percentage of the sellers who had intended to list but held off on listing this spring may be looking to get their properties on the market. If this materializes, we would see reduced demand met with increasing supply, and the sell/list ratio in the coming months will be a good indicator of what is taking place.

The sell price/list price ratio stepping down 1 point to 97% on both a month-over-month and year-over-year basis will be another indicator that we watch closely in the weeks and months to come. Will fears of declining prices and/or motivated sellers lead to increasing price concessions? Only time will tell, but as time goes on, the probability that “deals” may start to emerge is only increasing. 

Average days on the market for homes that sold dropped when compared against last month’s and last year’s figures. While at first glance this may be surprising, really it shouldn’t be. We still have buyers that made decisions pre-COVID 19, such as selling their home or accepting a job transfer, that put them in a position of needing to find a place to live. The other important point to make here is that this statistic reflects homes that sold only. That is 55. The month ended with 272 homes on the market, all of which didn’t factor into this figure. 

Lastly, the 272 homes on the market at the end of the month is down from last month’s and last April’s ending inventory figure. However, while there were 64 fewer homes on the market than at the end of April 2019, there were also 87 fewer new listings. While currently there is less supply, there is also less demand. When the economy eventually starts to emerge from the COVID-19 crisis, it will be interesting to see where inventory numbers are and how they are trending. For buyers hoping for a “good deal”, you should be hoping for lots of new listings and lower buyer demand. For sellers hoping the impact on home values is minimal, you should be hoping that most who had intended to list hold off and that both supply and demand begin to increase at a relatively similar pace. This may be the more optimistic outlook, but given the innumerable variables here and unprecedented level of government intervention, you never know...

Top Performing Neighbourhoods & Categories

9 of the 18 sub-areas defined by the real estate board in Nanaimo saw an increase in the average selling price (trailing 12 months) from March to April, with 12 of the 18 also experiencing increased prices year-over-year. When looking at these neighbourhood figures, it is important to note that we use trailing 12-month figures to limit volatility caused by lower transaction volumes in some neighbourhoods, where a few high priced or low priced transactions could tremendously skew results. A trailing 12 figure will always be slower to react than simple month-over-month, so that is why the results here are not going to be as pronounced as the figures used in the stats we report above. 

Moving on, these year-over-year average price changes range from -9.86% in North Jinglepot to 18.10% in Extension.  The top risers month-over-month were Extension, Lower Lantzville and Upper Lantzville.  Top performers year-over-year were Extension, Upper Lantzville, South Nanaimo, Hammond Bay, and Uplands. Looking at volume, only 2 of the 18 sub-areas saw increases month-over-month, Hammond Bay at 12.50% and Central Nanaimo at 1.10%, while 4 of the 18 sub-areas also saw increases year-over-year, with Hammond Bay also the top riser in this respect.

Insights: Difficult to draw any significant conclusions here. The Extension area leading the way with price increases both month-over-month and year-over-year may indicate that there are some buyers seeking larger properties. As a historically more affordable area, it also suggests that Extension may be benefiting from demand from those priced out of other neighbourhoods. Upper Lantzville was another top performer where larger properties are more common. Lantzville (Upper and Lower) is often high on the wishlist of buyers' preferred areas, especially out-of-town buyers.  As expected given overall market figures, volume was down for the vast majority of sub-areas. 

Single-family homes and townhouses (on lower volume) were the only two categories that saw an increase in average sale price from March to April, while all categories, with the exception of apartment-style condos and lots, experienced increases in average sale prices year-over-year.   No categories reported month-over-month increases in sales volume, and only single-family water homes on low volume posted a year-over-year increase.

Insights: We reported above that single-family home volume was down 47% over last April. Other categories were hit much harder, so the low categorical volumes make it hard to rely upon these stats with confidence as an accurate representation of market conditions or performance by category. In case you are interested in the impact on the various categories,  compared to last April, sales volume was down 86% for patio homes, 83% for lots, 68% for condo apartments, and 59% for townhouses. 

Opportunities

Firstly, in light of the current COVID-19 pandemic, it is important to emphasize that if at all possible it is best for everyone to continue to do their part to help prevent the spread of COVID-19. What this continues to mean for most is that it is likely best to put their purchase or sale of real estate on hold until the authorities have confirmed that it is safe to resume more regular daily activities without the heightened risk of contracting or spreading COVID-19. With that being said, the Government of British Columbia has deemed real estate agent services a COVID-19 Essential Service, as for a small percentage of the population there is an urgent need to complete a real estate transaction. With this being the case, efforts are being made where possible to conduct business virtually, but for those who do insist on or require physical showings of properties, strict protocols remain in place following all regulatory guidelines to help minimize the risk of any adverse health implications for anyone involved. 

For the vast majority of buyers, if you were thinking about a spring purchase, now is a great time to really familiarize yourself with the local real estate market as using this time to educate yourself will help you quickly recognize a great offering when you see one when the time comes, when it is safe to get out and look at some properties. What are some ways someone could go about educating themself on the market? First, get familiar with the various neighbourhoods in town and the types of lifestyle benefits, conveniences, and amenities they offer. Determine where new construction is happening, and what these newer less familiar neighbourhoods have to offer. For the neighbourhoods that meet your lifestyle requirements, go online and see what homes are selling for in these neighbourhoods, and how they compare. From here you may have a neighbourhood or two that you want to keep a close eye on. By closely following new listings and sales that are happening, it will help you to better understand how far your dollar will stretch, and also help you quickly recognize when a solid offering hits the market that may be underpriced or offer significant value. 

If you haven’t already done so, now is also a great time to reach out to a trusted mortgage broker or your bank, as well as possibly your investment advisor to proactively get your finances in order to ensure you are in a position to act when the COVID-19 health concerns dissipate. While we realize most are experiencing some financial pain right now, engage your financial team early to have them be part of the solution and have you well-positioned to act when the timing is right. They will also be able to answer many of your questions, such as how a temporary layoff may impact your ability to obtain financing. 

If you haven’t already connected with a Realtor, now would also be a great time to do so. Typically at this time of year, Realtors are flat out trying to keep up with the demands of the spring market. This year Realtors have more time available and many are eager to assist with helping out however they can, making sure you are well informed and ready to act when more regular market conditions resume. Take your time in finding a well-respected Realtor with a proven track record who knows the market well and will put your interests first at all times. Once you have found a good option, get your Realtor working for you. As a Buyer, in most cases this costs you absolutely nothing, so why not take advantage of this assistance as early on as you can in your home search process. Start with an initial consultation which can be done remotely via video conferencing technologies or phone call, and take it from there…

For Sellers, is now a good time to sell? Really, that depends on your personal circumstances, what you are selling, and what you are looking to achieve. Consulting with a trusted Realtor, who can help you weigh the pros and cons would be an important early step. Above all else, make staying safe your number one priority. For those with vacant homes, if you must sell, now is a time where a vacant home may have an advantage over an occupied home, as naturally there are no health risks to the occupants and it is easier to coordinate showings. Whatever the case, if you are listing make sure your Realtor has a strategy to best position you to minimize the COVID-19 concerns for not only you and your family but for everyone else involved (Buyers, Realtors, Inspectors, etc.). This would include showing schedules and protocols intended to minimize the possible transmission of germs but also having a solid online marketing platform to showcase your home that will help minimize foot traffic. Now is not the time to list with your “For Sale Sign & Cell Phone Picture” Realtor.

For investors, with us, it always gets back to the numbers. Values so far have not been significantly impacted, so from an appreciation standpoint, considering there are headwinds and concerns about the economic path forward, purchasing right now represents increased risk that you could find yourself in a situation in the coming months with a property that has a value lower than when you purchased it. This makes it more important than ever that any investments are cash flow positive and achieve an acceptable rate of return because if you acquire a negative cash flow property, your only guarantee in the short-run is the property will be costing you money. With an increased probability of values declining, buying a property that is costing you money each month, and has a decent chance of losing value (at least short term) doesn’t seem like an overly prudent investment approach. However, if you do come across an investment where the numbers do work well and you are a long-term investor and are comfortable assuming the risks that in the short term there is a reasonable probability we will see average home values fall, then maybe you don’t want to rule out a purchase this spring as long as you are adhering to all of the protocols in place to protect your health and the health of others. The reality, unfortunately, is that mass economic slowdowns create financial hardship, which inevitably at some stage will likely result in some good buying opportunities. While we don’t have a crystal ball, it is our take that things are likely to get worse before they get better, especially if the COVID-19 concerns linger longer than expected, or we have a second wave heading into fall and winter as is increasingly being prepared for. We believe on the buy side, patience is likely going to be rewarded. Remember, much of your ultimate return is derived from your entry point, the price you were able to purchase at. Right now sub-$700k, most homes are still being listed at all-time highs. So, for most investors, stay safe, educate yourself on the local market, be patient, watch out for deals if and when they emerge, make sure you are running the numbers, and if the numbers work, be ready to act. In this regard, don’t feel shy to reach out and get the conversation going with a good investment-focused realtor. They are here to help.

Remember, over time real estate generally appreciates. We just know there are peaks and valleys. Buy on the way to the peak and you are positioning yourself for success, buy on the way to the valley, not so much, at least in a short-to-medium timeframe. Right now we have reason to believe we may be more likely on the way to a valley than the peak, but only time will tell.  It is our mandate to provide you with information that you can use to determine which side of the peak we are on, and ultimately to help you make informed decisions that you will not regret. 

Above all else, stay safe, do your part in flattening the curve, and we wish you and all those close to you the best of health!

For a consultation specific to your situation, or if you have any questions about market conditions, please contact us at info@jahelkagroup.com and we would be happy to help.

Check out the Nanaimo Market Statistics Here:  Market Stats April 2020

Source: VIREB

Disclaimer: The information presented is intended for general information purposes only and should not be construed as Real Estate advice. Each client's situation is unique and therefore we recommend consulting directly with your professional advisors (Realtor, Accountant, Lawyer, Investment Advisor, etc.) prior to making any real estate decisions. Not intended to induce breach of an existing agency agreement or solicit properties currently listed for sale or individuals currently under contract with a Brokerage.


April 9, 2020

COVID-19 and Real Estate Agent Services


COVID-19 and Real Estate Agent Services


The Government of British Columbia has deemed “Real Estate Agent Services” a COVID-19 Essential Service. However, that certainly doesn’t mean the industry should continue on as usual, as we all have to do our part to flatten the curve. As a team, we have received quite a few questions recently related to COVID-19 and its effect on the real estate market, and so thought we would take some time to compile a few thoughts, as well as some resources, to help you navigate this unprecedented pandemic. However, we first wanted to mention that we hope everyone reading this and those closest to you are remaining healthy and in good spirits. We also wanted to relay our sincere gratitude to all the medical professionals, hospital staff, first responders, grocery store workers, delivery drivers, and all other essential service providers who are putting their own health at risk for the benefit of the rest of society. 

What precautions are being taken by Realtors to help prevent the spread of the novel coronavirus? The list here is extensive, so in the interest of your time, information provided here will highlight some of the measures taken.

Buyers

Firstly, before any showings occur, initial buyer meetings and consultations can happen remotely through videoconferencing or by way of a telephone call. From here, once the search has begun, the most effective way to help reduce the spread of COVID-19 is to avoid physical showings. With various technologies such as 3D walk-through tours, Google Earth, etc., it is fairly easy for the realtor and client to conduct virtual showings and neighbourhood tours from the comfort of their respective homes. If a buyer has serious interest in a home and there are no virtual tours or suitable properties to facilitate a virtual tour, the Realtor could help facilitate a virtual tour by visiting the property using technologies such as FaceTime, as long as the Realtor meets a set of qualifications, such as confirming they have not recently travelled outside of Canada, do not have any concerning symptoms, have not had contact with anyone with symptoms, or come in contact with any presumptive or confirmed COVID-19 cases in the last 14 days. If a buyer narrows down their search to a single property but is not comfortable offering on the property without physically viewing it, and the Buyer has consulted government and health authority guidelines and is comfortable assuming the risks of a physical visit,  then the Realtor can attempt to make the necessary arrangements to ensure the safety of the Buyer and the home’s occupants. This would start with confirming in writing that both the buyer and seller meet qualifications outlined above that a realtor would need to meet to tour a property (confirming they have not recently travelled outside of Canada, had any concerning symptoms, had contact with anyone with symptoms, or come in contact with any presumptive or confirmed COVID-19 cases in the last 14 days.) The seller would be asked to leave all lights on and doors open to help reduce the need for any physical contact. Some measures taken during the showing to reduce the potential spread of COVID-19 would include, but would not be limited to the following: Realtor and client meeting at the property, no physical contact on greeting, limiting showings to only those who would be listed as Buyers on the contract, not sharing electronics, disinfecting hands immediately prior to entry, not touching surfaces and keeping hands in pockets, and ensuring at least 2 meters distance between the Realtor and clients at all times. Again, this list is not exhaustive, and will be modified as the health authorities' guideline’s change. The showings will be conducted as quickly as is possible, and any follow-up discussion, correspondence, and working through offers should be done remotely. 

Sellers

The best way for sellers to avoid risking contracting or contributing to the spread of COVID-19 is to avoid listing their homes. However, for some due to their life circumstances (job transfer, marriage breakdown, financial pressures) waiting is not an option. If this is the case, then at the onset of the initial conversation, the realtor should verify with the seller that they have not recently travelled outside of Canada, had any concerning symptoms, had contact with anyone with symptoms, or come in contact with any presumptive or confirmed COVID-19 cases in the last 14 days. Assuming this is the case, then every attempt should be made to determine a listing price for the home remotely. Technologies such as FaceTime, WhatsApp, etc., will facilitate the Seller virtually walking the Realtor through the home, so in addition to reviewing past listings, having the seller take videos or photos, as well as being available to answer any questions about the home, its construction, materials, size, measurements, etc., the Realtor should be able to guide a fairly accurate discussion with the seller about the value of the home. If this is not possible, then the realtor should arrange to tour the property and home independently and avoid coming into close contact with the seller. The listing agreement can be signed remotely using an online signature program. From here, arrangements will be made for various marketing partners (photography, floorplans, videography, 3D tours, etc.) to be completed. In Nanaimo some of the regular providers of these services have temporarily closed, so for the ones that remain open, the Realtor would confirm that they meet the qualifying criteria to enter the home (described above), and reconfirm that none of the home’s occupants’ situations have changed related to travel, health conditions, possible exposure, etc. Assuming all is good, the marketing partners would visit separately while the seller is out of the home, and all would take the necessary precautions such as disinfecting their hands and touching nothing, among other measures. With a solid marketing platform featuring 3D walk-through tours, video, floorplans, professional photography, etc., physical showings can be kept to a minimum. If a Realtor does request a physical showing, both the Realtor and the potential Buyers would have to confirm in writing that they meet the qualifying criteria (have not recently travelled outside of Canada, had any concerning symptoms, had contact with anyone with symptoms, or come in contact with any presumptive or confirmed COVID-19 cases in the last 14 days), and specific instructions would be provided to help prevent the potential spread of COVID-19. Showings would be restricted to only those whose names would appear on the contract, and the Sellers would need to leave on all lights, open doors, etc, and would need to be out of the home for the duration of the showing. Following showings, any offers received would be reviewed and negotiated remotely. Due diligence such as inspections or appraisals, would be done following the protocols in place for those professions to help reduce the potential spread. Home inspections, for example, are completed by an on-site visit by the Inspector and followed up with a call or video chat with the Buyer and Realtor.

Again, what has to be emphasized is that this list is not exhaustive, it simply provides some measures intended to serve as an example of how serious the COVID-19 threat is being taken by the real estate industry, and also hopefully giving you an idea of what you could possibly expect if you absolutely needed to transact in real estate in the near future. 

Why would someone want to put their own health and the health of others at risk in order to buy or sell real estate? Can’t people just wait until the COVID-19 concerns calm down and the officials declare it safe for society to return to more of a normal way of life? Unfortunately, there are some people who don’t have a choice and this is why the Government of BC has deemed Real Estate Agent Service an COVID-19 Essential Service. For example, there are those that have sold a home and need to find a place to live, there are those who have purchased a home and need to sell their place to fund their purchase, and there are those who received a job transfer or accepted a new job and gave notice at their previous job prior to the COVID-19 pandemic unfolding. There are also unfortunate circumstances such as a messy divorce or extreme financial hardship that necessitate sales. The reality is most of these people would most likely prefer to be in a situation where they weren’t having to put their own health or the health of others at risk, unfortunately, timing didn’t work in their favor, so the real estate industry at large has implemented procedures and protocols to help deliver this essential service for the benefit of this small segment of the general population who need to complete a real estate transaction in the spring of 2020.

I was planning to purchase a home this spring. Should I put my search on hold? Each individual’s circumstances are different, so we cannot make any specific recommendations or blanket statements without knowing the facts. What we can say is that for the vast majority of buyers, yes, absolutely you should be putting your home search on hold, and doing everything you can to help flatten the curve. If you must buy or you absolutely insist on buying, please take every precaution to reduce the need and if at all possible, avoid physical showings. With that said, if you are comfortable completing a transaction 100% remotely, have strong job security, and aren’t fearful that the home you are purchasing may see its value decline short term, then you may be a candidate to help a seller in need of finding a buyer. However, if you can limit your exposure to COVID-19, help prevent the spread to others, and likely find yourself in a position where market conditions are softer in the coming months on the heels of mass layoffs and therefore reduced buyer demand which may result in you having more negotiating power or being able to buy at more attractive price points than you could right now, it seems like a fairly straightforward decision to wait unless you have an urgent need.

I was planning to list my home this spring. Should I hold off? As discussed above, each individual’s circumstances are different, so we cannot make any specific recommendations or blanket statements without knowing the facts. What we can say is that for the vast majority of sellers, yes, absolutely you should be putting your home sale on hold, and doing everything you can to help flatten the curve. If you absolutely need to sell your home to fund another home purchase that is already under contract or have another urgent need to sell such as a job transfer, then the industry has measures in place to help manage the COVID-19 related concerns. However, what you should discuss with your realtor is the anticipated demand for your home, as this will vary for different styles, neighbourhoods, and price levels. There are currently 345 single-family homes on the market as of April 8, which is up from 288 at the end of March. That is to say that the drastically reduced buyer pool has a decent amount of homes to choose from, so you have to realistically consider how probable a sale would even be in this market, and whether it is worth exposing yourself or others to the risk of COVID-19 if the prospects of a sale are unlikely. That is not to say homes are not selling. We received 4 offers on a home listed just last week, but this was a quality offering at a price level where there is still relatively strong buyer demand. The home was also vacant and there was a strong marketing plan, including a 3D walk-through tours available, so buyers didn’t necessarily need to visit the home, and if they did, each showing was not exposing the sellers to a new risk of infection. On that note, if you do have a vacant property that you NEED to sell this spring, as long as all necessary precautions are taken, it is a rare situation where you are likely better positioned to sell than an owner-occupied or tenant-occupied property, and of course this eliminates the health risks to the owner or tenant that would follow every showing. 

If I do hold off on selling, could home values be down substantially by the time it is deemed safer to list? In terms of possible decreasing home values and whether holding off on listing now may cost you, the reality is short term it could. On the other hand, there is the possibility that it won’t. There are so many unknown variables. The government has already taken massive action to help mitigate the damage to the Canadian economy and we don’t know what further measures will be implemented to best position Canada for a quick recovery. We don’t know how long this health threat will persist, how many jobs will be lost, and how many people who are absolutely redlining their finances will be pushed into unmanageable territory. We don’t know how accommodating lenders will be with approvals for those that have seen their incomes reduced or received a temporary layoff. The list goes on and on. While we don’t have a crystal ball, collectively our team has a fairly extensive list of academic credentials and past work experience that positions us strongly to be able to interpret the ever-evolving narrative and help our clients make informed decisions. With that said, outside of all of these unknown variables such as government intervention, recovery timing, etc., supply and demand is a good place to start in trying to form an idea of how pricing may be impacted. From a demand perspective, ask yourself, are we more likely to have more demand or less demand whenever the current situation ends? Remember, all those extremely motivated and qualified to buy are doing so. From our perspective, the longer this drags out, the more jobs that are lost and businesses that see their temporary closures become permanent closures, the more people who eat into their down payment funds just to pay the bills, the more credit is utilized, all of this points to reduced buyer demand. If there are not enough buyers for the volume of homes for sale (which could very well increase substantially with so many intending to sell holding off), that is when we start to see motivated sellers start to drop their prices, and prices will ultimately adjust until they reach the point of equilibrium where demand equals supply. From the supply side, ask yourself the same question? Are we likely to have more supply or less supply a number of months from now? The difference between demand and supply is that despite intentions, demand can be eliminated beyond the control of the intended buyer due to factors such as job loss or a reduction of downpayment. The supply side is not affected in such a way. If a seller wants to sell, they can list their property. Fear of declining values in the future or reports of declining values (if this does occur) may prompt owners to list, increasing supply. Supply and demand considerations are certainly something we’ll be monitoring closely, and we will be doing so not just considering the overall market, but demand and supply at different price points, in different neighbourhoods, and for different categories of real estate.

What is interesting is that of late we have heard all sorts of chatter from other Realtors about how the market with all of this pent up demand from the delayed spring market is going to result in a very hot market when the COVID-19 concerns lift. It’s a nice thought, and likely helping to ease the fears of the realtors who have seen their spring earnings drastically reduced, if not eliminated, but let’s be realistic… In order to buy a home, you need to either be paying cash or have a mortgage approval. Unless you are independently wealthy, for a good percentage of the population, either of those options may be in jeopardy depending on how long this plays out. Consumer confidence also plays a factor, is there going to be rebound in COVID-19 cases, could another pandemic strike?...If people aren’t already, 2,3,6 months from now many will be very much living in fear, fear about their health, their job security, their income, how they are going to make their next payment. Fear does not generally trigger people to commit to major purchases and substantial mortgage payments. As time plays on intended spring buyers and their urgency of demand is likely to trend more towards a “wait and see” approach, especially for those living in fear of making a major commitment. When you couple this with all those who will have lost their ability to qualify for financing or who have reduced their down payment below what they need to purchase, you can make a reasonable argument that overall demand will be substantially lower than the realtors expecting a buoyant, 2017-style competitive market are calling for. 

What is this unexpected interruption to the spring market going to mean for market conditions? At this stage, it is too early to tell. As detailed above, there are certainly too many unknown variables. The longer the self-isolation period continues, the longer and more widespread the economic slowdown is likely to be. If the B-20 stress tests or the implementation of the Foreign Buyer tax, speculation tax, or any other government measure that was implemented in early 2018 can have the cooling effect on what was a screaming 2017 market, then ask yourself what the effect of the whole country basically shutting down for a number of weeks if not months, with mass layoffs may do? The government understands this, and certainly the role that real estate plays in our economy and net worth statements of Canadians. It would be surprising if they didn’t take aggressive action to try to protect the economic impact of the industry, home values, and to try to mitigate the risks of household debt levels, but to what extent and ultimately how effective will any measures be is difficult to predict. As such, we take a wait and see approach, turn off the negative new cycle, and rely on trusted, credible experts and our own market expertise and understanding of economics, to interpret and apply in our advisory approach to helping our clients navigate the ever-changing real estate market. 

When would you expect the real estate market to get back to normal? Before tackling this question, what should probably be addressed first is an acknowledgement that we may never return to the “normal” we knew prior to the onset of COVID-19. When you look back at the catastrophic events of September 11, 2001, we get a reminder every time we go through airport security that we are living in a “new” normal with heightened levels of fear and government regulations, and air travel is not ever going back to what it was pre-9/11. However, human beings are incredibly resilient, so while society will likely be different post-COVID-19, we will adapt and find our way, with the economy eventually strengthening, as it always does. 

Moving on, to address the question which is more narrowly focused on the real estate market, again, without the crystal ball and with so many unknown variables, it would be foolish to suggest we could make a prediction with accuracy. The answers to the two previous questions provide some insight into some of our thought process in interpreting the market, but the timing question is just so challenging. Sometimes you will hear the suggestion of looking at past economic events as a good indication of what may be to come. While we certainly don’t disagree that there could be some value in this approach, we’d suggest doing so with caution, as the world is changing so rapidly that past timelines are becoming less and less indicative of likely future outcomes. Take for example the news cycle and the prominence of digital and social media in our society. Dissemination of information happens quicker, is around the clock and is unavoidable, good or bad. Currently, much of the population is glued to their TV waiting for the latest update. Market sentiment fuels market activity. If economic news is positive, recoveries are quicker, if it is negative, again, more drastic immediate action is taken. When the health concerns dissipate, the initial few months and the real estate market activity will certainly have an impact on market psychology. If the market is better than expected, you’ll hear about it in the news, confidence will grow, buyers may not want to miss out on a good buying opportunity. On the flip side, disappointing market activity will likely lead to increased fear that “the sky is falling”, in which case buyers will take caution and sellers may try to get listed “before it is too late”, resulting in a demand/supply imbalance. Government intervention is a second major factor that wasn’t as prominent pre-2008. Within weeks of the growing concerns of COVID-19 in Canada, the Bank of Canada overnight lending rate had been cut by 1.5%. Sitting at .25% there is no more room to accommodate here, but what else does the government have in its arsenal to help mitigate the economic damage? You can’t argue that they haven’t been quick to act with the various policies, subsidies, benefits, etc., that have been introduced in a very short time period, which again serves to set the stage for a potentially accelerated recovery, depending on what is introduced, and how it is managed. So how about COVID-19 itself? Not enough is known about the virus or its growth curve for the experts to be able to make any reasonable predictions on timeline, so it would be laughable to think that a group of realtors could even take a stab at it. Could there be a second wave? It all factors into the recovery timing conversation. 

Here are some other factors outside of the real estate market statistics that we will be watching to help us formulate a more accurate opinion on recovery timeline: Employment levels, credit supply, changing lending guidelines, interest rates, household debt levels, construction and new housing supply, consumer confidence, GDP, financial market performance, tourism activity, transit volume such as ferry traffic, airport arrivals etc., international arrivals, and more. 

Do you think I can get a better deal if I hold off on buying for a while? If you have had the patience to continue on reading to this point, you should have a pretty good idea at how we may tackle this question...1. We don’t have a crystal ball. 2. There are too many unknown variables and it is too early to tell. 3. There are indicators that we are watching that will help us formulate an opinion, but this information and the various data points are ever-evolving. 4.There is some fundamental economic theory that we can use to assist in interpreting the market. 

On this note, let’s look at a few different economic scenarios, particularly related to supply and demand considerations. If it takes 2, 3, 6 months for the COVID-19 concerns to cool down, at that stage we can have less buyer demand, similar buyer demand, or more buyer demand? Remember to factor in that buyer demand is not just about intention, it is also about qualification. With rampant job loss, businesses likely to close, credit utilization increasing, and consumer confidence taking a hit, ask yourself how strong do you expect buyer demand to be when we emerge from this? Similarly, ask yourself the same question about supply. Do we have more homes on the market, a similar number, or more listings? As time goes on in the first few months of the economic recovery, does supply outpace demand, or demand outpace new supply? We’ll refrain from making any bold predictions here, as I’m sure from what has been written above you likely have a decent idea of how we may answer if we had to make a call. What we will do, is outline how you may be able to use this information to assist in formulating your own conclusions. So here it is... In general with all else being equal, in a scenario where demand exceeds supply, there is upward pressure on pricing, when demand is roughly equal to supply pricing should be relatively constant, and when supply exceeds demand eventually there is downward pressure on pricing.

OK, ok, I know you probably are hoping for more than us essentially telling you to figure it out...So if we had to make a call, we would say, yes, there will likely be opportunities to secure a better deal than you could in March or April of 2020 in the coming months. Timing-wise we don’t know when, location, category and price points-wise, we won’t attempt to get into specifics, but our expectation would be that there will be some opportunity here. What I do want to make clear is that we are not suggesting that all categories, locations, or price brackets will see opportunities for a “better deal”, as all have their own demand and supply profiles that may be affected to a lesser or greater extent by current world events. What we’d suggest may be a prudent use of the next few months is for buyers who were intending to purchase this spring to really spend the time to immerse themselves in understanding the market they are intending to buy into. That way if and when good deals start to emerge, you will be in a position to act. Also remember, most listings on the market currently are not casual listings. Most sellers are motivated or they would not be subjecting themselves and others to the health risks if they didn’t have a need to sell. As time goes on without a sale, this motivation only increases. Eventually when sales happen, these become the new comparables that are relied upon to price homes and negotiate offers.

Helpful Resources: Here are some resources that may be useful to keep you informed and help navigate the COVID-19 crisis:

Coronavirus (COVID-19) - Health Link BC

Information on Novel Coronavirus - BC Centre for Disease Control

Coronavirus disease (COVID-19): Outbreak Update - Government of Canada

Public Health Agency of Canada - Government of Canada


Information for Real Estate Consumers on COVID-19 - Real Estate Council of British Columbia


COVID-19 and Tenancies - Government of British Columbia

Supporting Renters, Landlords during COVID-19 - Government of British Columbia: Municipal Affairs and Housing


Coronavirus Disease (COVID-19) - Government of Canada - Employment and Social Development Canada

Canada Emergency Response Benefit - Government of Canada - Department of Finance Canada

Additional Support for Canadian Businesses from the Economic Impact of COVID-19 - Government of Canada - Department of Finance Canada

Canada’s COVID-19 Economic Response Plan - Government of Canada


BC Hydro Announces Bill Help - BC Hydro


Understanding Mortgage Payment Deferral - CMHC

BMO: 1-877-895-3278

CIBC: 1-800-465-2422

First National: 1-888-488-0794

HSBC: 1-888-310-4722

Manulife: 1-877-765-2265

MCAP: 1-800-265-2624

RBC: 1-800-769-2511

Scotia: 1-800-472-6842

TD: 1-866-222-3456

Stay safe, do your part in flattening the curve, and we wish you and all those close to you the best of health!

For a (virtual) consultation specific to your situation, or if you have any questions about market conditions, please contact us at info@jahelkagroup.com and we would be happy to help.

Disclaimer: The information presented is intended for general information purposes only and should not be construed as Real Estate advice. Each client's situation is unique and therefore we recommend consulting directly with your professional advisors (Realtor, Accountant, Lawyer, Investment Advisor, etc.) prior to making any real estate decisions. Not intended to induce breach of an existing agency agreement or solicit properties currently listed for sale or individuals currently under contract with a Brokerage.


Posted in Information
April 7, 2020

Nanaimo Market Statistics March 2020


Overall March Market Conditions Surprisingly Resilient in Light of COVID-19


Given the developments of the COVID-19 pandemic in the Month of March, including the proactive measures essentially shutting down much of the local economy that were taken in an effort to flatten the curve, as well as the aggressive moves made by the federal government to lessen the economic blow, we are certainly operating in unprecedented times. As the month of March is when the COVID-19 concerns and subsequent actions really ramped up in our market, March’s market statistics must be looked at in the context of what has just occurred. We realize even producing a monthly recap may seem completely redundant, given what has occurred and how different the world and economic outlook appears than it did just one month ago. However, on the flip side with March being a pivotal month signifying the start of the spring season, we felt it was important to report on what occurred, especially as a follow up to the building signs of a strengthening market, as this may (and I caution “may”) shed some light on what is to come when the COVID-19 concerns begin to lift. 

Single Family Price and Volume

90 single-family homes sold in March, up 36% from the 66 that sold in February, but 5% less than the 95 that sold in March of last year. The average sale price slipped back under the $600k mark, coming in at $592,262, down 1.4% from February’s average of $600,648, however, this figure was still up over 8% from last March when the average sale price came in at $546,656. The median sale price decreased by over 3% from $585,000 in February to $565,000 in March, which is 7% higher than the same time frame last year when the median sale price was $530,000. 185 homes were listed in March, which was 45% more than the 128 homes listed in February, but 7% less than the 198 listed in March of 2019.

Insights: The fact that March’s sales volume saw only a 5% decrease from last March is somewhat remarkable given the fact that it was really the second week of March when the industry really started to adapt to combat the COVID-19 threat. Yes, last March’s sales volume was down from the March results in the preceding 5 years, but you have to think had it not been for a week 2 slowdown, sales volume was poised to post a fairly respectable increase over last March. 

We had a slight downtick in the average sale price, and a more noticeable decrease in the median price, suggesting more homes were selling at the lower end of the pricing spectrum. While this may not seem to be a huge surprise given that many of the higher-priced homes are sold to out-of-market buyers, whom due to COVID-19 concerns are essentially staying home unless they had a pressing need (eg. new job, etc.) to find a home in our region, it was surprising to see that already 10 home sales have been registered over $800,000 for March, including 6 over $1,000,000. It has been some time since we have seen 6 seven-figure sales in a month, just another confirmation that the market and interest from out-of-town buyers was improving prior to the COVID-19 slowdown.

There were 7% fewer new listings than last March, which again is a bit surprising to see this decline in the single digits, as it would be reasonable to assume that with the area more or less “on pause” for the time being, that sellers may have been fearful of the health risks of having people touring their homes, and listing volume would have decreased substantially. While some people don’t have a choice due to major life changes such as job transfers, etc., for the rest of the “non-urgent” population, it was somewhat surprising to see the volume we did. Despite the figures, many undoubtedly held off on listing their homes, so again, you would have to think we would have seen a noticeably higher number of new listings than we did had it not been for COVID-19. So why do we figure listing volume was higher than expected? While we don’t know with certainty, one theory would be people thought they would try to get their homes sold before market conditions started to deteriorate. 

So how did Nanaimo stack up against other Island communities north of Victoria for the month of March? Looking at the average price of a single-family home, Nanaimo up 9% year-over-year was eclipsed to the upside by Port Alberni, which was up 14% on declining volume. The Comox Valley and Cowichan Valley were both up 8%, Parksville/Qualicum was up 5%, and Campbell River was up 3%.

Looking at sales volume in comparison to last March, Comox Valley was up 54%, Campbell River was up 28%, Parksville/Qualicum was up 19%, Cowichan Valley was down 4% and Port Alberni/West Coast had the steepest decline, down 27%.  

Looking at the entire Vancouver Island Real Estate Board totals, the average sale price was up 8%, while sales volume overall also rose 8% from March of 2019. These are surprising figures and can only leave one wondering “what would have been?” if not for the current pandemic. 

Strength of the Trend

Factors we also look at when analyzing a market to validate its strength are the sell/list ratio; sell price; days to sell, and current inventory numbers:

The sell/list ratio decreased to 49% in March from 52% in February but was up slightly from March of last year when it was 48%. 

The average sell price/list price was 98% in March which represents no change from last month or from the same time frame last year.

The average days on the market for the homes that did sell in March decreased by 15% to 29 days from February’s 34 days, which is also 12% lower than in March of last year when days on market averaged at 33.

As of the end of March, the number of active listings was 288, up 19% from February’s 243 active listings, and 8% lower than the same time last year when there were 312 active listings at month-end.

Insights: Of the 8 market indicators we look at in this section, 4 improved, 2 deteriorated, and 2 remained unchanged. 

The sell/list ratio at 49% is a marginal decrease and still relatively strong considering world events in the month of March. Similarly, the average sell price/list price held constant at 98%, the same figure as both last month and last year. This is not to say all home sales are being sold at a 2% discount to list price, as both stale and overpriced listings are factored in here, that may see negotiated transaction prices at higher percentages below the asking price. What this figure also may suggest is that so far for all those deal hunters out there, COVID-19 has not resulted in sellers in mass being willing to accept lower offer prices for fear that market conditions get worse and they may not be able to get as much in the future as they could today.

Average days on the market for homes that sold dropped when compared against last month’s and last year’s figures. While at first glance this may be surprising, really it shouldn’t be. We still have buyers that made decisions pre-COVID 19, such as selling their home or accepting a job transfer, that put them in a position of needing to find a place to live. As such, Buyers who were actively still in the market despite the health concerns, by and large, were motivated. Depending on how long the COVID-19 concerns persist, we would expect the level of urgency overall to decline, and as such days on market figures overall (as it is an average) will likely increase. That’s not to say if you need to sell and you have an extremely unique offering that it will not sell quickly, you will just need to ensure that comparatively speaking you stand out from the competition, so working with a real estate Advisor in tune with economic conditions, competition, with a strong marketing platform maximizing exposure to your target market, and pricing accurately and competitively will be as important as ever to best position you to achieve the results you are looking for.

Lastly, the 288 homes on the market at the end of the month is slightly below where March of 2019 ended, but above what we had in the 3 preceding years. Looking back further, the period from 2012 to 2015 had listing numbers at the end of March slowly declining from 554 in 2012 to 426 in 2015, before the big drop to 271 in 2016. So in a broader historical context, listing volume is quite low.  What this means is buyers have less choice and that is something that is different than when we were hit with other major macroeconomic events such as the 2008 Financial Crisis. Coming out of the COVID-19 crisis, it will be interesting to see where inventory numbers are, but if we had to make a call, we would suggest they likely won’t be overly elevated unless the market is flooded with new listings from those holding off because people who don’t “need” to sell likely won’t be taking the risk while health concerns persist, and if market conditions are poor following the health concerns subsiding, in the absence of a need to sell, it would make sense to wait for market conditions to improve to list. Again, we do not have a crystal ball, but we do see the lower current inventory levels as a positive that could help with a speedy recovery once the health concerns dissipate.

Top Performing Neighbourhoods & Categories

11 of the 18 sub-areas defined by the real estate board in Nanaimo saw an increase in the average selling price (trailing 12 months) from February to March, with 12 of the 18 also experiencing increased prices year-over-year. When looking at these neighbourhood figures, it is important to note that we use trailing 12-month figures to limit volatility caused by lower transaction volumes in some neighbourhoods, where a few high priced or low priced transactions could tremendously skew results. A trailing 12 figure will always be slower to react than simple month-over-month, so that is why the results here are not going to be as pronounced as the figures used in the stats we report above. 

Moving on, these year-over-year average price changes range from -11.93% in North Jinglepot to 14.05% in Upper Lantzville.  The top risers month-over-month were Lower Lantzville, Extension, and Cedar. Top performers year-over-year were Upper Lantzville, Cedar, Hammond Bay, and South Nanaimo. Looking at volume, 7 of the 18 sub-areas saw increases month-over-month with Lower Lantzville coming in as the top riser, while 6 of the 18 sub-areas also saw increases year-over-year, with Departure Bay the top riser in this respect.

Insights: Difficult to draw any significant conclusions here. From a volume perspective, both top performers (Departure Bay and Lower Lantzville) are both areas that historically have been attractive to out-of-town buyers, based on the lifestyles offered. Aside from this, some neighbourhoods are up, some are down, with seemingly no particular rhyme or reason. This raises an important point...Not all neighbourhoods and classes of real estate move up and down at the same rate throughout the cycle. If you are considering a purchase that extends beyond the lifestyle considerations of a principal residence, given the economic uncertainty we are entering into, working with a realtor that has a good pulse on neighbourhood profiles and historic market action is very important. 

Single-family waterfront homes and patio homes (both on low volume), apartment-style condos, and townhouses were categories that all saw an increase in average sale price from February to March, while all categories, with the exception of lots, experienced increases in average sale prices year-over-year.   Month-over-month increases in sales volume were only reported in single-family homes and single-family waterfront homes, while only patio homes, townhouses, and lots posted year-over-year increases.

Insights: While the lower volume must be factored in, seeing waterfront homes and patio homes post strong average price gains, is likely a result of (at least in early March) a resurgence of out-of-town buyers looking to secure their retirement residence of choice. We’ve talked in past market recaps about how improving Lower Mainland conditions are poised to positively impact certain categories and styles of real estate in our area. These 2 categories would be benefactors in this regard...With that said, we are not sure whether there will be any follow-through on this or if current economic challenges may again delay out-of-town buyers from returning on mass to our area. 

Opportunities 

Firstly, in light of the current COVID-19 pandemic, it is important to emphasize that if at all possible it is best for everyone to do their part to help flatten the curve. What this means for most is to put their purchase or sale of real estate on hold until the authorities have confirmed that it is safe to resume more regular daily activities without the heightened risk of contracting or spreading COVID-19. However, the Government of British Columbia has deemed real estate agent services a COVID-19 Essential Service, as for a small percentage of the population there is an urgent need to complete a real estate transaction. With this being the case, efforts are being made where possible to conduct business virtually, but for those that do insist on or require physical showings of properties, strict protocols are in place following all regulatory guidelines to help minimize the risk of any adverse health implications for anyone involved. 

For the vast majority of buyers, if you were thinking about a spring purchase, now is a great time to really familiarize yourself with the local real estate market. I heard someone recently use the term “calibrate your opinion of value”, and this struck me as an accurate description of how I feel you could be effectively using this time to educate yourself on the local market so that you know a great offering when you see one. What does this involve? First, get familiar with the various neighbourhoods in town and the types of lifestyle benefits, conveniences, and amenities they offer. Determine where new construction is happening, and what these newer less familiar neighbourhoods have to offer. For the neighbourhoods that meet your lifestyle requirements, go online and see what homes are selling for in these neighbourhoods, and how they compare. From here you may have a neighbourhood or two that you want to keep a close eye on. By closely following new listings and sales that are happening, it will help you to better understand how far your dollar will stretch, and also help you quickly recognize when a solid offering hits the market that may be underpriced or offer significant value. 

If you haven’t already done so, now is also a great time to reach out to a trusted mortgage broker or your bank, as well as possibly your investment advisor to proactively get your finances in order to ensure you are in a position to act when the COVID-19 health concerns dissipate. While we realize most are experiencing some financial pain right now, engage your financial team early to have them be part of the solution and have you well-positioned to act when the timing is right. They will also be able to answer many of your questions, such as how a temporary layoff may impact your ability to obtain financing. 

If you haven’t already connected with a Realtor, now would also be a great time to do so. Typically at this time of year, Realtors are flat out trying to keep up with the demands of the spring market. This year Realtors have more time available and many are eager to assist with helping out however they can, making sure you are well informed and ready to act when more regular market conditions resume. Take your time in finding a well-respected Realtor with a proven track record who knows the market well and will put your interests first at all times. Once you have found a good option, get your Realtor working for you. As a Buyer, in most cases this costs you absolutely nothing, so why not take advantage of this assistance as early on as you can in your home search process. Start with an initial consultation which can be done remotely via video conferencing technologies or phone call, and take it from there…

For Sellers, is now a good time to sell? Really, that depends on your personal circumstances, what you are selling, and what you are looking to achieve. Consulting with a trusted Realtor, who can help you weigh the pros and cons would be an important early step. Above all else, make staying safe your number one priority. For those with vacant homes, if you must sell, now is a time where a vacant home may have an advantage over an occupied home, as naturally there are no health risks to the occupants and it is easier to coordinate showings. Whatever the case, if you are listing make sure your Realtor has a strategy to best position you to minimize the COVID-19 concerns for not only you and your family but for everyone else involved (Buyers, Realtors, Inspectors, etc.). This would include showing schedules and protocols intended to minimize the possible transmission of germs but also having a solid online marketing platform to showcase your home that will help minimize foot traffic. Now is not the time to list with your “For Sale Sign & Cell Phone Picture” Realtor.

For investors, with us, it always gets back to the numbers. From an appreciation standpoint, there are headwinds right now and a purchase represents increased risk that you could find yourself in, in the coming months holding a property with a value lower than when you purchased it. If you are a long-term investor and you can find an exceptional deal on paper and you are not subjecting yourself to increased health risk, possibly by using the technologies at hand and physically walking through the listings, then maybe you don’t want to rule out a purchase this spring. The reality, unfortunately, is that mass economic slowdowns create financial hardship, which inevitably at some stage will likely result in some good buying opportunities. While we don’t have a crystal ball, it is our take that things are likely to get worse before they get better, especially if the COVID-19 concerns linger longer than expected. We believe on the buy side, patience is likely going to be rewarded. Remember, much of your ultimate return is derived from your entry point, the price you were able to purchase at. Right now sub-$700k, most homes are still being listed at all-time highs. So, for most investors, stay safe, educate yourself on the local market, be patient, watch out for deals if and when they emerge, make sure you are running the numbers, and if the numbers work, be ready to act. In this regard, don’t feel shy to reach out and get the conversation going with a good investment-focused realtor. They are here to help.

Remember, over time real estate generally appreciates. We just know there are peaks and valleys. Buy on the way to the peak and you are positioning yourself for success, buy on the way to the valley, not so much, at least in a short-to-medium timeframe. Right now we have reason to believe we may be more likely on the way to a valley than the peak, but only time will tell.  It is our mandate to provide you with information that you can use to determine which side of the peak we are on, and ultimately to help you make informed decisions that you will not regret. 

Above all else, stay safe, do your part in flattening the curve, and we wish you and all those close to you the best of health!

For a consultation specific to your situation, or if you have any questions about market conditions, please contact us at info@jahelkagroup.com and we would be happy to help.

Check out the Nanaimo Market Statistics Here:  Market Statistics March 2020

Source: VIREB

Disclaimer: The information presented is intended for general information purposes only and should not be construed as Real Estate advice. Each client's situation is unique and therefore we recommend consulting directly with your professional advisors (Realtor, Accountant, Lawyer, Investment Advisor, etc.) prior to making any real estate decisions. Not intended to induce breach of an existing agency agreement or solicit properties currently listed for sale or individuals currently under contract with a Brokerage.

March 5, 2020

Nanaimo Market Statistics February 2020


Average Price Holds Over $600k, While Sales Volume Remains Light


Single Family Prices and Volume

66 single-family homes sold in February, up 53% from the 43 that sold in January, and 5 less than the 71 that sold in February of last year. The average sale price of $600,648 dipped slightly from January’s average of $603,720, however, this figure was still up nearly 10% from last February, when the average sale price came in at $546,662. The median sale price increased by 1% from $579,000 in January to  $585,000 in February, which is 14% higher than the same time frame last year when the median sale price was $515,000. 128 homes were listed in February, which was 22% more than the 105 homes listed in January, and 7% more than the 120 listed in February of 2019.

Insights: The average sale price of $600,648 represents the second-highest monthly average sale price for a single-family home in Nanaimo’s history. While the average did pull back slightly, this comes on the heels of three consecutive months of increasing average prices, and the jump in median price, up 14% over February of 2019’s median, also supports that it is not just a few seven-figure sales at the top end of the market really skewing the results. Looking at average price increases alone, so far 2020 is off to a solid start.

Looking at sales volume, the 66 homes sold was lower than February’s volume figures in any of the preceding 5 years. While there were more new listings this February than last, with 243 active listings at the end of the month, this figure is still relatively low by historical standards, as the average number of active listings at the end of the month over the past 5 years has been 314. What this implies is the lower sales volume can likely be partially attributed to buyers having less choice at the price points they are qualified to purchase at. Further, when you see the average price now slightly above $600k, the market is continuing to price out buyers. Currently just over a third of the homes on the market are priced below the average sale price, yet for the homes registered as sold so far in 2020, nearly two-thirds sold below the average sale price. What this suggests is that there continues to be fairly strong demand at the lower end of the market, while inventory levels remain elevated at higher price points where there is limited demand, largely as a result of income levels of the local population containing the purchasing power of these buyers. 

With that said, if you’ve been following our commentary, you will know that something we have been keeping a close eye on now for a number of months is the sales volume at the higher end of the market. So far for February, there are 6 registered sales of homes over $800k in Nanaimo, with 1 over $1,000,000. With 100 homes currently on the market priced at $800k plus, and 54 of these over $1,000,000, there is certainly no shortage of supply at the higher end of the market. Our take is that continued improvement in the Lower Mainland market should help with absorption at higher price levels, but to what extent is hard to say. At some stage, more SOLD signs will drive more listings, as we still have the looming mass-downsize for those empty nesters who are looking to trade in their 3,000+ square foot family homes for the convenience of a lower maintenance option to allow them to enjoy their golden years. It will be interesting to see how this all plays out as local buyers simply don’t have the qualifying incomes to be able to purchase these larger homes at current price levels. We see the volume of out-of-town buyers (both domestic and international) with the qualifying income to buy these homes as a significant variable that will impact the mid to high end of the market over the next decade. As many domestic buyers are targeting Central Vancouver Island as their retirement destination of choice, the likelihood that they are looking to buy a 20-year old, 3,000+ square foot home that is functionally and aesthetically in need of a 6-figure update, just because the home has a decent ocean view I would suggest may not be an overly likely scenario to play out. What I see as potentially the best chance for mass absorption of these larger, now aging homes wrapping from North Nanaimo around to Departure Bay on the view corridor is increasing foreign buying on the back of mass media exposure for Vancouver Island. Families, and in some cultures, multi-generational families require space, and these cookie-cutter spec homes built to capitalize on the ocean views when building costs were much lower, budget permitting provides a solid option. 

So how did Nanaimo stack up against other Island communities north of Victoria for the month of February? Looking at the average price, Nanaimo up 10% year-over-year was eclipsed to the upside by Campbell River, which was up 13%. Parksville/Qualicum was up 9%, and the Cowichan Valley and Port Alberni/West Coast were both up 3%. The Comox Valley was the lone decliner, down 4%  from last February. 

Looking at sales volume in comparison to last February, Port Alberni/West Coast was up 53%, Parksville/Qualicum was up 50%, Cowichan Valley was up 43% and Comox Valley was up 3 %. Nanaimo down 6% and Campbell River down 19% were the only decliners.

Looking at the entire Vancouver Island Real Estate Board totals, the average sale price was up 6%, while sales volume overall rose 15% from February of 2019. 

With improving market conditions on the Lower Mainland and price increases in both Nanaimo and Parksville/Qualicum, we continue to keep a close eye on Central Vancouver Island conditions as we head into the spring market. We believe a strengthening Lower Mainland market should be a catalyst for resurgent demand from empty-nesters looking to retire on the Island. 

February’s volume increase of 50% and average sale price increase of 9% over last February in Parksville/Qualicum, the epicentre of retirement destinations, is certainly a positive early indicator in this regard.

Strength of the Trend

Factors we also look at when analyzing a market to validate its strength are the sell/list ratio; sell price; days to sell, and current inventory numbers:

The sell/list ratio increased to 52% in February from 41% in January but was down 12% from February of last year when it was 59%. 

The average sell price/list price was 98% in February, up 1% from last month and no change from last year.

The average days on the market for the homes that did sell in February decreased by 26% to 34 days from January’s 46 days, which is slightly higher than February of last year when days on market averaged at 32.

As of the end of February, the number of active listings was 243, up 13% from January’s 215 active listings, and 6% lower than the same time last year when there were 259 active listings at month-end.

Insights: Of the 8 market indicators we look at in this section, 4 improved, 3 deteriorated, and 1 remained unchanged. 

The sell/list ratio at 52% is still relatively strong, however, it is important to remember that there is still limited activity at the top end of the market, and as an average, this slow-moving higher-priced inventory is serving to pull down the overall sell/list ratio. This is why it is important as both a buyer and seller to be informed on what is going on in your price bracket and not rely on overall market averages as indicators of what you can expect. When you have 100 active listings currently priced above $800,000 and only 6 sales in February at this price level, which followed the 2 in January, these figures suggest if you are listing a home at the top of the market, your chances of securing a sale may not be great. However, if you relied on a 52% sell/list ratio to help forecast how likely a sale would be, this figure would tell a different story. 

Overall, none of the results in this section are overly surprising or telling. The market is showing some signs of moderate strength, such as the sell price/list price ratio at 98% and average days on market at 34%, but activity is still largely constrained from a volume perspective by the lack of supply of new homes being listed at prices buyers are able to afford.

Top Performing Neighbourhoods & Categories

11 of the 18 sub-areas defined by the real estate board in Nanaimo saw an increase in the average selling price (trailing 12 months) from January to February, with 12 of the 18 also experiencing increased prices year-over-year. When looking at these neighbourhood figures, it is important to note that we use trailing 12-month figures to limit volatility caused by lower transaction volumes in some neighbourhoods, where a few high priced or low priced transactions could tremendously skew results. A trailing 12 figure will always be slower to react than simple month-over-month, so that is why the results here are not going to be as pronounced as the figures used in the stats we report above. 

Moving on, these year-over-year average price changes range from -13.04% in Lower Lantzville to 14.19% in Upper Lantzville.  The top risers month-over-month were Cedar, Upper Lantzville, and Chase River. Top performers year-over-year were Upper Lantzville, Cedar, South Nanaimo, Hammond Bay, and South Jingle Pot. Looking at volume, 7 of the 18 sub-areas saw increases month-over-month with Hammond Bay coming in as the top riser, while 6 of the 18 sub-areas,  Departure Bay, Brechin Hill, Cedar, South Jingle Pot, Pleasant Valley, and Upper Lantzville, also saw increases year-over-year.

Insights: Difficult to draw any significant conclusions here. Looking at top average price risers month-over-month, the one parallel that can be drawn is the top 3 are all on the outskirts of this zone and typically offer larger lot sizes, however, we never put too much weight into a single month’s results, as these results could be simply coincidental. Aside from this, some neighbourhoods are up, some are down, with seemingly no particular rhyme or reason. This raises an important point...Not all neighbourhoods and classes of real estate move up and down at the same rate throughout the cycle. If you are considering a purchase that extends beyond the lifestyle considerations of a principal residence, at this stage in the cycle working with a realtor that has a good pulse on neighbourhood profiles and historic market action is very important. 

Apartment-style condos, townhouses, and lots were the only categories that saw an increase in average sale price from January to February, with single-family waterfront homes (on extremely low volume) and apartment-style condos the only two categories to experience a decrease from February of last year. Townhomes and patio homes both posted year-over-year gains above 15%. Month-over-month increases in sales volume were reported in single-family homes, patio homes, townhouses, and lots, with the latter two being the only categories to experience year-over-year increases.

Insights:  It is not completely unexpected to see the average prices increasing significantly for both townhouses and patio homes given the affordability challenges pricing buyers out of the single-family market and turning to townhouses as the next best alternative, and the demographic driven shift in housing demand towards more ground-oriented housing that we are witnessing with the aging population, driving demand and price action for patio homes. With continued resurgent demand from out-of-town buyers targeting Central Vancouver Island as their retirement destination of choice and a lack of quality ground-oriented, low maintenance residences within our city limits, this category seems poised for further strength. That is unless buyers take a drive up to the Parksville/Qualicum area which, in our opinion, has done a much better job overall of building their housing supply to cater to the needs of the aging population. 

Opportunities 

For the better part of the last 2+ years, we have witnessed the market trending towards more balanced conditions than we experienced in the preceding 3 years (2015-2017). Nearing the end of 2019 there were some initial signs that the market may be starting to show some signs of life. January and February results have supported the notion that there is reason to be optimistic about improving market conditions in 2020, and the results coming out of the Lower Mainland for January (Sales volume up 44.9% overall from February of 2019, with a 20.7% decrease in active listings) are also positive signs for our market, as those buyers who have not been able to sell in the past couple of challenging years across the pond appear to now have a more likely probability of selling their homes, paving the way for a move to our region.

Without strong demand from Lower Mainland Buyers, as well as cooled foreign buyer demand on the heels of the foreign buyer tax introduced in 2018, the single-family home market in Nanaimo has seen an increasing divergence, essentially becoming the tale of 2 markets where we don’t have enough quality homes at affordable prices to satisfy the demand at lower price points, and we have an oversupply in the $800k+ category. 

What does this mean for buyers? Well, as long as inventory levels remain elevated at higher price points, at some stage motivated sellers are going to adjust their pricing expectations to secure a sale. As Days on Market (DOM) add up for a listing, with each passing day, the likelihood of price reductions or concessions increases if the sellers have some motivation. If you are in the market for and looking in the $800k+ range, some patience, as well as diligence in trying to find signs of motivation (price drops, vacant homes, etc.), could go a long way in securing a solid purchase as price levels fall below where they may have been 2 years ago at the peak of the frothiness. 

For sellers, given the lack of quality homes below $700k, if you are thinking about listing, as long as you are priced correctly, you should be well-positioned to sell into fairly strong demand, especially with the right marketing plan maximizing exposure. If, and that is a big if, we do see increasing Lower Mainland and foreign buyer demand at higher price points, then the spring of 2020 may represent the best opportunity since 2017 to sell a quality home at the higher end of the market. However, given the supply, homes will need to be priced accurately and competitively to be best positioned against the competition.

For investors, on the buy side, patience is going to be rewarded. If you are considering an income property, our take is that if you can find an opportunity where the numbers work, eg. positive cash flow, it is worth exploring. If your strategy is to gamble on increasing values, you may be taking on unnecessary risk exposure entering the market at this time if it is a negative cash flow property, as, despite some early signs the market may be improving, the reality is the only guarantee you will have is that you will be paying money out each month until rent levels rise. Again, patience monitoring the market for signs of a sustained uptrend could help you avoid a “false start” scenario. While we understand over time real estate generally appreciates, timing plays a significant role in investment returns, so just be cautious and make sure you are working with a qualified realtor who understands investment real estate and can give you the information you need (both positive and negative) to make smart decisions. Sometimes your best offense is a good defense.  

Remember, over time real estate generally appreciates. We just know there are peaks and valleys. Buy on the way to the peak and you are positioning yourself for success, buy on the way to the valley, not so much, at least in a short-to-medium timeframe. It is our mandate to provide you with information that you can use to determine which side of the peak we are on, and ultimately to help you make informed decisions that you will not regret. 

For a consultation specific to your situation, or if you have any questions about market conditions, please contact us at info@jahelkagroup.com and we would be happy to help.

We Need Your Feedback

With more than 4,700 current subscribers to our monthly newsletter, we are in the process of “repackaging” our delivery of the monthly market recap and are looking for feedback from you, our valued subscribers on how you would like to see this information presented moving forward. Should we continue with the long-form text with original insights and interpretation as has been the model, shorten it up to just hit the high points, move to video, add more graphs and charts, all of the above? You tell us what you’d like to see from us as the market leaders in real estate market analysis in Nanaimo and we’ll work towards making it happen. Feedback can be directed to admin@jahelkagroup.com 

Check out the Nanaimo Market Statistics Here:  Market Statistics February 2020

Source: VIREB, REBGV

Disclaimer: The information presented is intended for general information purposes only and should not be construed as Real Estate advice. Each client's situation is unique and therefore we recommend consulting directly with your professional advisors (Realtor, Accountant, Lawyer, Investment Advisor, etc.) prior to making any real estate decisions. Not intended to induce breach of an existing agency agreement or solicit properties currently listed for sale or individuals currently under contract with a Brokerage.

Feb. 4, 2020

Nanaimo Market Statistics January 2020

Average Single-Family Homes Price Sets All-Time Record High in January


Single Family Prices and Volume

43 single-family homes sold in January, 36% less than the 67 that sold in December, and 12 less than the number sold in January of last year. On this lower volume, the average home price went up 6% in January to $603,720  from December’s average of $571,519 which was 11% higher than reported last January when the average home price was $544,902. The median sale price increased by 5% from $553,250 in December to $579,000 in January, which is 8% higher than the same time frame last year when the median sale price was $535,000. 105 homes were listed in January, which was 52% more than the 69 homes listed in December, but 30% less than the 150 listed in January of 2019.

Insights: On its own, the average sale price of $603,720 represents the highest monthly average sale price for a single-family home in Nanaimo’s history, and the first time the figure has crossed over the $600k threshold. It is also the third consecutive month of increasing average prices, and the jump in median price (albeit not as drastic), also supports that it is not just a seven-figure sales in a low volume month really skewing the results. With that said, the sales volume at 43 homes sold was, in fact, a 5-year low, so this must also be taken into consideration when you see these significant percentage moves. If you follow our commentary, you know our position that one, even two months does not make a market. While three lower volume months isn’t enough to suggest we are once again in a confirmed uptrend, it does make us pause and take note, and gives reason for continued optimism (at least for sellers) as we head towards the traditionally more active spring market.

Listing volume was down 30% from last January, which means buyers had less new supply to choose from, which undoubtedly impacted the number of offers that were written and accepted. However, what also must be taken into consideration is the weather. Nanaimo in January experienced the highest level of precipitation in over a year, and we had nearly a week where snow was significantly impacting our transportation. It is likely that the weather not only kept buyers from viewing homes but also kept sellers from listing, as the weather has a significant impact on the marketing material generated for homes being listed, as well as on the first impression that is made when a buyer views a home for the first time. This is particularly relevant for lifestyle properties, ocean view homes, and oceanfront homes. If you can’t see the ocean through the fog, the emotional draw of the view is certainly minimized, and for many buyers, emotions drive offer decisions. It is our opinion based on results over the past 5 years in this market, that timing the weather for a listing to go live has much more of an impact than most people would give it credit for (including their realtors who have photography shot on a stormy day in a rush to get a listing live).

The market is back...up 6.3% from last November...OK, hold on, maybe that isn’t exactly the case. However, depending on where you get your real estate news, that may be what you have heard. While a 6.3% increase in the average sale price is a positive sign, we have to look at this figure in context. If instead it was reported that the average price was actually down .71% from September, down 4.67% from May’s average, and down 2.83% from the average sale price 15 months ago in September of 2018, all of which are accurate, your opinion of the current state of the market may be significantly different than just hearing that the average home price is up 6.3%. Statistics can certainly be misleading, and a single month does not make a market. The reality is last November’s average price was an outlier, the lowest monthly average since January of 2018, $26,850 below October 2018’s average, and $42,656 below December 2018’s average. This is why it is so important to look at the bigger picture and the stats that are being reported in the context of the market. With that out of the way here comes the clip that hasn’t changed for a number of months now in this section: “The average home price continues to be fairly range-bound, a trend that has persisted since early 2018, coinciding with a time period when we started to really notice a decrease in sales volume. Over the past 20 months or so, this range-bound average price has fluctuated between a low of $532,299 (November 2018) and a high of $593,326 (May 2019). It seems it is a few months up, a few months down, as the market has failed to gain any significant traction one way or another. This is consistent with the notion that we are trending towards a more balanced market, and the market is in a bit of a consolidation pattern after a few years of sustained upward pressure on pricing.”

Something we have been keeping a close eye on now for a number of months is the sales volume at the higher end of the market. So far for January, there are 2 registered sales of homes over $800k in Nanaimo, both over $1,000,000. With 93 homes currently on the market priced at $800k plus, and 47 of these over $1,000,000, there is certainly no shortage of supply at the higher end of the market. Our take is that continued improvement in the Lower Mainland market should help with absorption at higher price levels, but to what extent is hard to say. At some stage, more SOLD signs will drive more listings, as we still have the looming mass-downsize for those empty nesters who are looking to trade in their 3,000+ square foot family homes for the convenience of a lower maintenance option to allow them to enjoy the golden years. It will be interesting to see how this all plays out as local buyers simply don’t have the qualifying incomes to be able to purchase these larger homes at current price levels. We see the volume of out-of-town buyers (both domestic and international) with the qualifying income to buy these homes as a significant variable that will impact the mid to high end of the market over the next decade. As many domestic buyers are targeting Central Vancouver Island as their retirement destination of choice, the likelihood that they are looking to buy a 20-year old, 3,000+ square foot home that is functionally and aesthetically in need of a 6-figure update, just because the home has a decent ocean view I would suggest may not be an overly likely scenario to play out. What I see as potentially the best chance for mass absorption of these larger, now aging homes wrapping from North Nanaimo around to Departure Bay on the view corridor is increasing foreign buying on the back of mass media exposure for Vancouver Island. Families, and in some cultures, multi-generational families require space, and these cookie-cutter spec homes built to capitalize on the ocean views when building costs were much lower, provide a solid option,  budget permitting.

So how did Nanaimo stack up against other Island communities north of Victoria for the month of January? Looking at the average price, Nanaimo up 11% year-over-year was eclipsed to the upside by Port Alberni/West Coast up 22% on low volume, and on par with Cowichan Valley up 11%. Parksville/Qualicum was up a respectable 8%, and Comox Valley saw a modest improvement with their average sale price up 2%. Campbell River was the only decliner, down 3% from last January.

Looking at sales volume, only Parksville/Qualicum up 17% and Port Alberni/West Coast up 14% saw gains. Cambell River, Comox Valley, Cowichan Valley, and Nanaimo all saw significant volume decreases from last January, ranging from 22% to 42%. 

Looking at the entire Vancouver Island Real Estate Board totals, the average sale price was up 6% while sales volume declined 16% from January of 2019. With improving market conditions on the Lower Mainland price increases in both Nanaimo and Parksville/Qualicum, we will be keeping a close eye on Central Vancouver Island conditions heading into the spring market, as a strengthening Lower Mainland market would likely be a catalyst for resurgent demand from empty-nesters looking to retire on the Island. The fact that Parksville/Qualicum, the epicentre of retirement destinations, saw a 17% volume increase from last January is a positive early sign in this regard.

Strength of the Trend

Factors we also look at when analyzing a market to validate its strength are sell/list ratio; sell price; days to sell, and current inventory numbers:

The sell/list ratio decreased by 58% to 41% in January, down from 97% in December, but up 11% from January of last year when it was 37%. 

The average sell price/list price was 97% in January, up 1% from last month and from January of last year when the ratio was  96%.

The average days on the market for the homes that did sell in January decreased by 12% to 46 days from December’s 52 days, which is 7% higher than January of last year when days on market averaged at 43.

As of the end of January, the number of active listings was 215, up 5% from December’s 205 active listings, and 20% lower than the same time last year when there were 268 active listings at month-end.

Insights: Of the 8 market indicators we look at in this section, 4 improved, while 4 deteriorated.

Given the lower volume of new listings in January and the challenging weather conditions, it is not overly surprising that the sell/list ratio decreased, and average days on market increased, as the homes that couldn’t find a buyer prior to the turn of the calendar year didn’t have a great chance in a bad weather month with low buyer demand competing against the new listings hitting the market. 

None of the results here are overly surprising or telling and as such since we probably went a bit overboard above in our insight section, we’ll keep this section light and wait for more telling signs to elaborate on in months to come. 

Top Performing Neighbourhoods & Categories

7 of the 18 sub-areas defined by the real estate board in Nanaimo saw an increase in the average selling price (trailing 12 months) from December to January, with 12 of the 18 also experiencing increased prices year-over-year. When looking at these neighbourhood figures, it is important to note that we use trailing 12-month figures to limit volatility caused by lower transaction volumes in some neighbourhoods, where a few high priced or low priced transactions could tremendously skew results. A trailing 12 figure will always be slower to react than simple month-over-month, so that is why the results here are not going to be as pronounced as the figures used in the stats we report above. Moving on, these year-over-year average price changes range from -13.12% in North Jinglepot to 11.33% in Upper Lantzville.  The top riser month-over-month was Brechin Hill with Departure Bay the second-highest, however, it is important to mention that the month-over-month variance was minimal, from -2.46% in South Jingle Pot to 2.33% in Brechin Hill. Top performers year-over-year were Upper Lantzville, Hammond Bay, South Nanaimo, South Jingle Pot, and Cedar. Looking at volume, 4 of the 18 sub-areas saw increases month-over-month with Cedar coming in as the top riser, while only Cedar, Departure Bay, Pleasant Valley, and South Jingle Pot saw increases year-over-year.

Insights: As we are using a trailing-12 figure, this section may be confusing… In the opening section of this recap, we are reporting that the average sale price in Nanaimo is up 6% from December, but above we report that the top neighbourhood month-over-month is only up 2.33%. This is simply due to the reporting period and to the fact that a trailing-12 figure, needed to smooth out volatility resulting from low volumes in some neighbourhoods, isn’t going to react as quickly as the month-over-month reporting period does to changing conditions. While not an ideal solution, it is better than having 1 sale in a neighbourhood in a month and then using this single data point as a representation of price action in the neighbourhood overall. 

Aside from that, it is difficult to draw any significant conclusions here. Some neighbourhoods are up, some are down, with seemingly no particular rhyme or reason. This raises an important point...Not all neighbourhoods and classes of real estate move up and down at the same rate throughout the cycle. If you are considering a purchase that extends beyond the lifestyle considerations of a principal residence, at this stage in the cycle working with a realtor that has a good pulse on neighbourhood profiles and historic market action is very important. 

Single-family homes, apartment-style condos, patio homes, and lots were the categories that saw an increase in average sale price from December to January, with single-family homes, patio homes, and townhouses also experiencing increases from January of last year. Month-over-month increases in sales volume were reported in apartment-style condos, patio homes, and lots, with the latter being the only category to experience year-over-year increases.

Insights:  Again, not much for meaningful conclusions to be drawn as these figures continue to fluctuate from month to month. While we are seeing some improvements, categorically there are not really any trends or patterns that have been confirmed. In our 2020 Look Ahead we mentioned patio homes and single-family as the 2 categories we felt most likely to lead the way for 2020. While it is early and may very well be coincidental, these were the only 2 categories to post month-over-month and year-over-year gains. We’ll be keeping our eyes on follow-through here.

Opportunities 

For the better part of the last 2 years, we have witnessed the market trending towards more balanced conditions than we experienced in the preceding 3 years (2015-2017). Nearing the end of 2019 there were some initial signs that the market may be starting to show some signs of life. January results have supported the notion that there is reason to be optimistic about improving market conditions in 2020, and the results coming out of the Lower Mainland for January (Sales volume up 42.4% overall from January of 2019, with a 20.3% decrease in active listings) are also positive signs for our market, as those buyers who have not been able to sell in the past couple of challenging years across the pond appear to now have a more likely probability of selling their homes, paving the way for a move to our region.

Without strong demand from Lower Mainland Buyers, as well as cooled foreign buyer demand on the heels of the foreign buyer tax introduced in 2018, the single-family home market in Nanaimo has seen an increasing divergence, essentially becoming the tale of 2 markets where we don’t have enough quality homes at affordable prices to satisfy the demand at lower price points, and we have an oversupply in the $800k+ category. 

What does this mean for buyers? Well, as long as inventory levels remain elevated at higher price points, at some stage motivated sellers are going to adjust their pricing expectations to secure a sale. As Days on Market (DOM) add up for a listing, with each passing day, the likelihood of price reductions or concessions increases if the sellers have some motivation. If you are in the market for and looking in the $800k+ range, some patience, as well as diligence in trying to find signs of motivation (price drops, vacant homes, etc.), could go a long way in securing a solid purchase as price levels fall below where they may have been 2 years ago at the peak of the frothiness. 

For sellers, given the lack of quality homes below $700k, if you are thinking about listing, as long as you are priced correctly, you should be well-positioned to sell into fairly strong demand, especially with the right marketing plan maximizing exposure. If, and that is a big if, we do see increasing Lower Mainland and foreign buyer demand at higher price points, then the spring of 2020 may represent the best opportunity since 2017 to sell a quality home at the higher end of the market. However, given the supply, homes will need to be priced accurately and competitively to best position against the competition.

For investors, on the buy side, patience is going to be rewarded. If you are considering an income property, our take is that if you can find an opportunity where the numbers work, eg. positive cash flow, it is worth exploring. If your strategy is to gamble on increasing values, you may be taking on unnecessary risk exposure entering the market at this time if it is a negative cash flow property, as, despite some early signs the market may be improving, the reality is the only guarantee you will have is that you will be paying money out each month until rent levels rise. Again, patience monitoring the market for signs of a sustained uptrend could help you avoid a “false start” scenario. While we understand over time real estate generally appreciates, timing plays a significant role in investment returns, so just be cautious and make sure you are working with a qualified realtor who understands investment real estate and can give you the information you need (both positive and negative) to make smart decisions. Sometimes your best offense is a good defense.  

Remember, over time real estate generally appreciates. We just know there are peaks and valleys. Buy on the way to the peak and you are positioning yourself for success, buy on the way to the valley, not so much, at least in a short-to-medium timeframe. It is our mandate to provide you with information that you can use to determine which side of the peak we are on, and ultimately to help you make informed decisions that you will not regret. 

For a consultation specific to your situation, or if you have any questions about market conditions, please contact us at info@jahelkagroup.com and we would be happy to help.

We Need Your Feedback

With more than 4,700 current subscribers to our monthly newsletter, we are in the process of “repackaging” our delivery of the monthly market recap and are looking for feedback from you, our valued subscribers on how you would like to see this information presented moving forward. Should we continue with the long-form text with original insights and interpretation as has been the model, shorten it up to just hit the high points, move to video, add more graphs and charts, all of the above? You tell us what you’d like to see from us as the market leaders in real estate market analysis in Nanaimo and we’ll work towards making it happen. Feedback can be directed to admin@jahelkagroup.com 

Check out the Nanaimo Market Statistics Here:  Market Statistics January 2020

Source: VIREB

Disclaimer: The information presented is intended for general information purposes only and should not be construed as Real Estate advice. Each client's situation is unique and therefore we recommend consulting directly with your professional advisors (Realtor, Accountant, Lawyer, Investment Advisor, etc.) prior to making any real estate decisions. Not intended to induce breach of an existing agency agreement or solicit properties currently listed for sale or individuals currently under contract with a Brokerage.

Jan. 17, 2020

Nanaimo 2019 Market Recap

2019 Nanaimo Market Recap & 2020 Look Ahead


Single Family Prices and Volume

1,123 single-family homes were sold in 2019, down 7.3% from the 1,212 sold in 2018, which in itself was down 24% from the 1,605 homes that sold in 2017. The average sale price for a single-family home increased by 1.65% to $566,023 from $556,820 a year earlier. While the average price did increase slightly, the pace of average price growth has decelerated from the previous 2 years when our market experienced average sale price increases of 7% and 16% respectively. The median sell price, (which we rely upon as a secondary measure to gauge price action as it isn’t skewed by a few high priced homes selling at the top end of the market), came in at $549,000 for 2019, up 2.7% from $534,500 in 2018.

Insights: While sales volume was down and average sale prices stabilized in 2019, so far the Nanaimo area has fared quite well given the macro market slow down the real estate sector has experienced since early 2018. Realistically, in comparison to the Lower Mainland which experienced a far more pronounced correction, if 2019 was the turning point, we would look at this as somewhat of a “best case” scenario, after the strong run-up in average sale prices from 2014 to 2018.

As Canada’s retirement destination of choice, and just a 15-minute float plane ride from one of the most desirable and liveable cities in the world, we have often viewed Central Vancouver Island as being somewhat insulated from the more volatile downswings that are experienced in other markets across the country. Dating back to the last market cycle where volume peaked in 2007 (1702) and average price peaked in 2018 ($365,173), the most significant year over year average price decrease (in other words “the correction”) was a 3.8% decrease which occurred in 2009. From here, the average price was essentially range-bound between $351,286 and $363,985 for an extended period into 2014, when this cycles’ pricing appreciation started to take off, with the market stepping up 5.24% from 2013’s average sale prices.

While our average price increases have remained positive, as mentioned above, sales volume has now decreased for the second year in a row, and 2019’s volume of 1,123 units was 11% below the 10-year average. With decreased buyer demand from the Lower Mainland where potential buyers in our area have been unable to unload their Mainland residences, as well as decreased foreign buying on the heels of the foreign buyer and speculation taxes, what may not be getting as much press is the fact that our 7% decrease in sales volume was outpaced by a 9% decrease in listing volume. When you consider the somewhat stagnant top end of the market (more on this later), the sales volume of entry-level to mid-market homes was undoubtedly slowed by the lack of suitable homes listed for sale at price points that buyers were ready to buy at. The root cause is two-fold as, in addition to the decrease in listing volume, this is another byproduct of a multi-year run-up in price, where sellers become accustomed to seeing their home values rise significantly each year, and lose sight of the fact that this isn’t always the case, consequently overpricing their listings and not succeeding with their attempts to sell at the prices buyers are willing to pay for their home.

If you have been following our commentary, you know that for much of 2019 we were tracking the higher end of the market, essentially represented by homes above $800k in our market. In total, there were 127 single-family home sales above $800,000 in 2019, which was down from 135 in 2018 and 168 in 2017, which represents nearly a quarter less volume in this range. However, we saw the numbers even more pronounced above $1,200,000 where 2019’s 20 sales is less than half of the 41 sales that occurred in 2017. Above $2,000,000, the declining volume is even more drastic. Over the past 3 years, the number of sales over $2,000,000 has dropped from 7 in 2017 to 3 in 2018, to just 1 in 2019. So why has volume slowed so much at the top of the market? In our opinion, market corrections in other markets, most impactfully the Lower Mainland, in addition to reduced demand from foreign buyers on the heels of the foreign buyer tax and speculation tax being introduced, has resulted in much lower demand at the higher end of the market from buyers who have the financial resources to buy at that price point.

Something else that is important to keep in mind when looking at the average home price figures is that one of the other consequences of reduced sale volume at the higher end of the market is that the average sale price figures do not benefit from these homes pulling up the average. So while the overall average only shows an increase of 1.65%, there was, in fact, a decent level of appreciation that would have certainly outpaced this figure for many homes towards the lower end of the market.

The reality is the income levels of the local population simply cannot support the higher price levels, as the rapid appreciation between 2014 and 2018 significantly outpaced household income growth during that time period. Taken together with the increased reliance on consumer credit, the vast majority of local buyers simply don’t have the borrowing capacity to finance a home purchase at the higher end of the market. While money remains cheap (low interest rates by historical standards), this certainly won’t offset the financial constraints faced by most local buyers.

Our market then becomes the tale of 2 markets - 1. The local working-age population often raising their families, and 2. The out-of-town buyer making a lifestyle choice to live on Vancouver Island and who perceives our market to be good value and who has the financial means to purchase at the higher end of the market. It is our take that what we have experienced in the last 2 years is a marked slowdown of category 2 buyer demand. Meanwhile, category 1 has plodded along. Families grow, people get promotions or receive an inheritance and they want to upsize, conversely, the aging baby boomers who have become empty nesters are downsizing, so the market has remained relatively stable on this basis. What has been removed is heightened demand that outpaces supply from buyers with the capacity to pay, leading to competitive, often multiple-offer situations, that result in sustained upward pressure on pricing.

So if we are right, and as we have often mentioned in the past that “Vancouver is the straw that stirs the drink in the BC real estate market”, then current and anticipated 2020 market conditions in Vancouver are important to look at. The Real Estate Board of Greater Vancouver reported residential sales (detached, attached, and apartments) volume is up 3% over 2018 volume, but still down 29.6% from 2017 levels. Depending on the category, average prices were down in the 2-4% range. However, this doesn’t tell the whole story as a very slow start to the year led to a more robust second half of the year. In fact, December sales figures were up 88% from 2018, which was also 9.5% above the 10-year average. While we are quick to point out 1 month doesn’t make a market, this comes on the heels of an improving fall market and gives reason for some optimism following a temporary, but quite bleak, period for the Lower Mainland market.

Globalization and more specifically foreign buying is another factor we have referenced. Immigration numbers to Canada remain strong and the urbanization of both China and India, both home to over a billion, amongst other developing nations, has resulted in increasing demand from those looking to build a life in Canada. Technology and social media have also raised the profile of many small towns in Canada and has made it increasingly easy to purchase property sight unseen from abroad. With the world as our market, you have to realize that there is a limited supply of Oceanfront communities on the Westcoast of Canada. After Greater Vancouver and Victoria, Nanaimo is the 3rd largest city and by far the most affordably priced of the top 3, so for a foreign buyer moving from a major centre and thinking Port Alberni may be a bit too rural (not enough shopping, entertainment, restaurant choice, high-end housing), Nanaimo likely represents somewhat of a happy medium, and an overall good value package-offering. With an aging population and a shortage of workers to fill job roles and contribute to the tax base, immigration policy is likely to remain relatively liberal over the foreseeable future. This again sets the stage, outside of any major unforeseen macro events cratering the overall market, (eg. 2001, 2008), for a fairly optimistic medium-to-long-term future outlook on Central Vancouver Island.

A final consideration is technology, social media and social sharing, which we believe accelerated the run-up in prices over the last cycle, accelerated the downturn in major markets in Vancouver, and is likely to accelerate the next market cycle and the level of hype-driven speculation that goes along with it. There are more social media platforms and far more users of these platforms than in 2014 when the last upswing took off. While the market remained relatively subdued for 5 years following the cooling of the last market cycle, technology is likely to accelerate the cyclical swings we have come to expect, especially to the upside as industry pundits typically have a vested interest in a robust real estate market.

Stay tuned…

Strength of the Trend

Some of the factors we also look at when analyzing a market to validate its strength are sell/list ratio; sell price/list price; days to sell, and current inventory numbers:

The sell/list ratio increased year-over-year to 58% from 57%, the sell price/list price decreased to 97% from 99%, the average number of days it took a home on the market to sell increased in 2019 to 33 days, up from 25 in 2018, and the number of active listings as the calendar turned over was 205, 51 less than the 256 on the market at the end of 2018. With the end of the calendar year occurring in the midst of the holiday season and winter weather conditions that often deter seller’s from having their homes on the market, it is important to look at the inventory from another angle to get a better idea of how much choice buyers had throughout the year. With that in mind, the average month’s number of active listings at the end of the month was 325, up 2% from the average of 318 in 2018, suggesting that on average, overall buyers had marginally more homes to choose from in 2019 than in 2018.

Insights: There is nothing presented in this section that suggests anything other than that the market in 2019 trended more towards a balanced market, but by historical standards was still relatively strong. A sell/list ratio of 58% is closer to a seller’s market than a buyer’s market. A 97% sell price/list price is still very respectable. While 2016-2018 saw this figure at 99%, 97% is still a point above the 10-year average of 96% and demonstrates that sellers may be getting a bit more realistic with their expectations when negotiating the sale of their home. While the days on market (DOM) figure did creep up to 33 days, again, by historical standards, this is still quite a positive sign, as it is still well below the 10-year average of 41 days. Looking at the current number of active listings at the end of December in comparison to the figure a year prior may also be a bit deceiving, as there was a spike in ending inventory levels at the end of that year from what we had seen in a couple of year-ends before that. This could be partially attributed to the fact that the 122 sales in the last 2 months of 2019 were 27% lower than the combined sales volume for November and December of that year. Looking back a few years, 2017 ended with 191 homes on the market, 2016 ended with 190, and December of 2015 ended with 252 homes on the market.

What is important to note is that the sales volume for November and December of 2019 significantly outpaced the 2018 numbers. When you consider that for much of the year, especially in the early months, we had monthly sales volumes showing fairly noticeable declines from 2018 numbers, the strong end to the year is certainly a positive sign for the early 2020 market. Without drawing any serious conclusions, you do have to wonder if the recovering Lower Mainland market contributed to the sales volume at the end of the year in our market. We will certainly be keeping a close eye on sales volume figures and inventory levels in the early months of 2020, as any follow through here with increased sales volume on the back of increased demand without an increase in the number of new listings from the reduced listing volume we had in 2020 could set the stage for a competitive spring market with a resumption in the upward pressure of pricing.

Neighbourhoods

In 2019, 12 of the 18 sub-areas defined by the real estate board in Nanaimo experienced a price increase, however, the weight of the increase varied significantly depending on the sub-area. Of these, 2 experienced double-digit average price increases, namely top performer South Jinglepot at 13.77%, followed by Upper Lantzville at 10.97%, with the remainder of the risers posting single-digit gains. North Jingle Pot led the way to the downside with the average sale price declining 12.3%. Brechin Hill down 9.38% also experienced a noticeable step-down.

However, price alone does not tell the story of a market as volume also has to be taken into consideration. Of the 18 sub-areas in Nanaimo, only 5 experienced volume increases, Departure Bay, South Jinglepot, Cedar, University District, and Pleasant Valley. On the opposite end of the spectrum, the 5 areas that saw the most pronounced drop in sales volume were Lower Lantzville, Extension, Old City, Chase River, and Hammond Bay.

Insights:  When looking at the two neighbourhoods that saw the greatest increase in average sales price, digging a little deeper you soon discover that in 2018, South Jinglepot was actually the worst-performing subarea in Nanaimo, with an average price decrease of 8.9% from 2017 levels. Similarly, Upper Lantzville was the second-worst performing market in 2018 on this basis, posting a 0.14% increase from 2017, so it is not a huge surprise these 2 areas are showing a bit of a rebound.

Another interesting observation is that North Nanaimo, Departure Bay, Old City, and Lower Lantzville, which joined Brechin Hill and North Jingle Pot as the neighbourhoods where average prices decreased in 2019, are all neighbourhoods that in our experience were highly desirable to out-of-town buyers, and may have been a bit overheated. Not suggesting this will repeat, but if you look at the bottom 2 performers in 2018, by average sales price increase, they were the top 2 performers in 2019. Further, a resurgence of out-of-town buying could also support a rebound in these areas. We’ll have to take a wait and see approach on this though.

Something that is important to remember when looking at real estate markets, is despite the headlines, not all neighbourhoods are moving in the same direction all the time. With real estate being location-specific, it is vital to know what is going on in your area when determining whether the timing may be right to sell your home. For buyers, neighbourhoods will experience differing price action throughout the cycle. Again, it pays to know what is happening in each sub-area, to determine whether a purchase would be prudent….

Categories

Townhouses were the top-performing category with the average townhouse sale price increasing 11% in 2019. Apartment-style condos and single-family homes also experienced average price increases in 2019 of 4.18% and 1.65% respectively. Waterfront homes (down 8.69%) was the weakest performer by category, followed by patio homes down 2.93%, and lots, which saw average prices decrease by 0.73%.

From a volume perspective, lots up 35.48%, waterfront homes up 22.58%, and townhomes (2.43%) were up from 2018 sales figures, with patio homes (-20.22%), apartment-style condos (-15.15%), and single-family homes (-7.34%) all with decreased sales volume.

Insights: In the midst of a market slowdown linked in large part to affordability concerns, it is no surprise to see townhomes as the top performer in 2019. If you can’t afford a single-family home, what is your next best option? Often a townhome, as it is the most similar. Take it a step further, when you can’t afford a townhome, what do you purchase? That’s right, for many it will be an apartment-style condo, which was the number 2 performer on an average price increase basis. Conversely, with the affordability concerns that constrained further market appreciation and slowed demand, it is no surprise to see average waterfront homes prices in negative territory for 2019. Patio homes saw average prices decrease slightly which may be partially attributed to subdued demand from out-of-town retirees seeking single-family living, as well as the fact that local downsizers may be having challenges unloading their 3,000+ sqft. homes at the higher end of the market, which was discussed earlier in this report.

Looking at volume, the major gainers (lots and waterfront homes) were 2 of the top 3 underperformers in 2018, and the improved 2019 figures for both categories were still well below the volume figures experienced during the rising market from 2015-2017 and well below their 5-year average volume, so in other words, while improved, they just weren’t hit as hard as they were in the first year of this “slowdown” in 2018.

Looking Ahead - 2020

Once again time to pull out the old crystal ball...Well not exactly…From day 1 the Jahelka Real Estate Group has prioritized delivering value-added content, a true advisory approach in a largely transaction-driven business, where we make use of our formal education, training, and experience working with hundreds of buyers and sellers of real estate, to produce information and interpretation of the market to help keep you fully informed as a buyer, seller, investor or observer of the real estate market in the Harbour City. In our technology-driven society, anyone can report statistics, however, it is in the interpretation of these statistics and understanding how they may impact your personal circumstances, goals, and objectives, that define a true advisory approach to the provision of real estate services.

With that said, market timing is nearly impossible, however, there are signs, symptoms, and trends and indicators that we monitor on an ongoing basis to provide reasonable insight into the health of the market.

Aside from monitoring our local market which we report on monthly, here are a few other factors we are watching closely in 2020:

1. Lower Mainland Market: Lower mainland market activity is vitally important in our province. Consumer confidence in the real estate industry is largely influenced by the mass market media and the stories and statistics being highlighted, that often originate from local conditions in Vancouver. Market action in the Lower Mainland also impacts the perceived value of Central Vancouver Island. When prices rise rapidly in the Lower Mainland, not only do prices in our area seem increasingly affordable, but it presents an interesting value proposition, whereby families can cash in their real estate equity and find a similar or better quality home on the Island for a much more affordable price without a mortgage, in the process setting aside hundreds of thousands, possibly even millions, for investment elsewhere or for a rainy day, all the while enjoying the incredible, low-stress lifestyle Central Vancouver Island affords. The slowdown over the last couple of years has undoubtedly delayed the move to the Island for many empty nesters, as they have been simply unable to sell their Lower Mainland homes to make the move. For 2020, here are the implications for our market:

  • Improved Lower Mainland sales volume and average prices: An improved Lower Mainland market should result in increasing buyer demand, and this demand could be reasonably expected to occur at higher price points, where high-end homes appear to be great value in comparison to what is available at the same price on the Lower Mainland. While it could take some time to work through the existing supply of homes listed at the higher end of the market, once this happens (unless there is a huge surge in new high priced listings, which could happen as the baby boomers look to mass exit the 3,000+ sqft ocean view homes) we would expect prices to start their upward ascent. Lifestyle properties (in close proximity to the ocean, marinas, golf courses, etc.) certainly benefit from out-of-town buying, as do ground-oriented, low maintenance strata properties and ranchers, that are certainly appealing to the aging demographic targeting Vancouver Island as their retirement destination of choice.
  • Similar Lower Mainland sales volume and average prices: All else being equal, we would expect more of the same in our market…That is... more balanced market conditions, more competition at the lower end of the market from the local population higher and possibly increasing inventory levels above $800,000. If this is the case, a third consecutive year with subdued market activity at the higher end of the market could lead to some downward pressure on pricing as sellers who have been unsuccessful in selling thus far, may have to adjust their pricing downwards to find their buyers.
  • Worsening Lower Mainland sales volume and average prices: Buyer traffic from the Lower Mainland has not stopped over the past 2 years, it has just slowed. As much as anything it is the psychology of the Vancouver buyer that impacted our market, as they were much more comfortable in a multiple-offer situation than the local population. Further deterioration in the Lower Mainland market will erode confidence and ultimately reduce the level of buyer demand in our area.

2. Foreign buying: During 2016 and 2017, the years with the highest sales volume figures and average price increases in our area over the past decade, there was significant demand from out-of-town buyers, especially in some of the higher-priced neighbourhoods (eg. North Nanaimo, Hammond Bay). The introduction of the Foreign Buyer tax in our area in early 2018 coupled with eroded confidence in the BC Real Estate market, served to dissipate demand from Foreign buyers over the past two years. With globalization, digital exposure, and inward migration only increasing, at some stage the concern and market drag from the Foreign tax will be a thing of the past and more or less considered the cost of doing business that will be absorbed by buyers to enjoy the quality of life that only Canada’s west coast provides. The question is when? The world’s most populous developing nations are producing more and more millionaires with the means to afford the high-end real estate on Vancouver Island. This will be a story over the coming decades. International wealth and demand in our area will almost certainly threaten the local buyers’ purchasing power, which is largely constrained by their income. However, for 2020, we see the potential implications for our market as follows:

  • Foreign Buyer Demand Increases: Overall upward pressure on average pricing, increased absorption of the higher-end properties.
  • Similar Foreign Buyer Demand: Minimal impact on the market.
  • Foreign Buyer Demand Decreases: Reduced demand would slightly lower sales volume overall, and the higher end of the market that benefits from foreign buying would see inventory levels rise. Increasing supply without equivalently increasing demand will negatively impact values at the high end of the market.

3. Government Intervention: The Federal and Provincial governments implemented measures to cool the housing market, and cool it they did. The B-20 stress tests have negatively impacted purchasing power for the local population who are already challenged by income levels in our largely retail-driven local economy. The foreign buyer and speculation tax also had a negative impact. We don’t need to go much further with this, any additional cooling measures will do just that, whereas a more accommodative policy will help the market. The government understands (or at least should understand) that the real estate/construction industry is the number 1 economic driver in many communities across Canada, with real estate values also having a significant impact on net worth and consumer confidence. We’d be surprised to see any further cooling measures, but some favorable adjustments to the stress tests have been lobbied aggressively, so there is a chance we could see these measures relaxed. If they are, our local population will certainly benefit from the increased purchasing power, which should lead to increased demand at the lower to mid-market range, ultimately resulting in a positive impact on average sale prices.

4. Interest rates: BCREA predicted in its Mortgage Rate Forecast that the prime rate will hold steady throughout 2020 and the average 5-year discounted rate will increase minimally (6 basis points) in the second quarter, then hold steady for the balance of the year. Outside of any major unexpected events or economic challenges, we don’t see much change with interest rates throughout 2020. However, predictions are just that...predictions. Last year nearly all major bank economists were predicting 2-3 rate hikes. We didn’t see it, and fixed rates dropped significantly, so always use predictions cautiously when making decisions. The reality is money remains cheap, certainly cheaper than at the same time last year, and this is a positive for the real estate market.

5. The Canadian economy: There seems to be increasing concern about the overall health of the Canadian economy. There aren’t enough qualified workers to take the jobs of the retiring baby boomers, our labour costs for the extraction of natural resources is cost-prohibitive, pension liabilities are increasing, economic activity is largely concentrated around real estate/construction, and household debt levels remain elevated, partially the result of consumers using their home equity like an ATM to buy the life they see showcased by influencers on Instagram and Facebook. Resource extraction had been a strength for Canada since Confederation. Increasingly, the world is shifting from a resource-driven economy to a knowledge-driven economy and I would argue that Canada, for the most part, is failing to keep pace in this regard. While there are some emerging tech hubs (Vancouver, Southern Ontario), small-town Canada is not playing a role. Instead, many communities, such as Nanaimo, are currently more retail/serviced-based relying on inward migration and increased use of consumer credit on the back of elevated real estate prices to keep the economy alive. We’ve already seen a huge reduction in the impact of the resource sector, and looking at consumer trends (Do any Christmas shopping on Amazon?), retail is next. What is going to keep these small economies going? With increasing globalization, it is just as easy to hire a graphic designer or web developer in India, who may be better qualified and cost less, than it would be to hire one locally. Without the requisite skills to compete, and an aging population to support, the Canadian economy is facing some headwinds in the coming decades relative to other more progressive, populous markets. Eventually, these concerns will rear their ugly head. Will it be 2020? Tough to predict. However, deteriorating economic conditions if this does occur in 2020 will undoubtedly negatively impact buyer demand, purchasing power, and ultimately the real estate market.

These are just some of the factors we will be watching in 2020 as we analyze and interpret the market for the benefit of our client base. Regurgitating the real estate board stats simply doesn’t lead to well-supported advice, and how to best play it for your specific real estate goals. With that said, and since you may be wondering, if we had to make a prediction on what we’ll be reporting in our 2020 recap, it would go like this:

  • Single-family average sale price: Increase (+)
  • Single-family median sale price: Increase (+)
  • Single-family sales volume: Increase (+)
  • Single-family sell/list ratio: Increase (+)
  • Single-family average sell price/list price: 97-98%
  • Days to Sell: Decrease (-)
  • Top Performing Neighbourhoods: North Nanaimo, Lower Lantzville, Brechin Hill
  • Top Performing Categories: Patio homes and single-family homes

Be sure to catch our monthly market recaps for commentary on changing market conditions and the implications for buyers, sellers, and investors in our market.

Working with an educated, experienced Realtor who is able to navigate you through the inevitable ups and downs of the market over time has never been more important, ensuring you are fully informed and well-positioned to minimize your downside risk while being well-positioned to benefit when opportunities present themselves. If you are contemplating making a move in the year ahead, in a market where you have nearly 400 realtors to choose from, you have a lot of choice.

As we continue on in somewhat uncertain times, more so than in years past, this choice will matter. An interesting nuance with our industry is that by and large, most realtors/brokerages charge a similar rate of commission for their services. This just isn’t the case in most other professional service industries. Imagine a scenario where you could hire the top lawyer in town to represent you in a legal case or you could hire his most junior associate who is on his first day on the job, for the same cost. There wouldn’t even be a question about who you would go with. For many, real estate will be the largest asset they ever hold, so the stakes are high. You deserve to stay informed, and whether you work with us or not, as the market continues to change, please align yourself with trusted advisors who will put your interests first at all times, and bring with them the qualifications, proven results, and a solid understanding of the market required to best position you for success.

Please never hesitate to reach out and please feel free to use us as a resource as you work towards your real estate goals.

All the best for 2020!

250.751.0804 | info@jahelkagroup.com | www.jahelkagroup.com

Source: VIREB, REBGV   https://www.rebgv.org/market-watch/monthly-market-report/december-2019.html

Dec. 5, 2019

Nanaimo Market Statistics November 2019

Some Positive Signs for the Nanaimo Market in November


Single Family Prices and Volume

100 single-family homes sold in November, 3 more than the 97 that sold in October, and 24 more than what sold in November of last year. The average home price went up 1.6% in November to $565,632 from October’s average of $556,717 and this figure was 6.3% higher than reported last November when the average home price was $532,299. The median sale price increased marginally from $539,500 in October to  $547,500 in November, which is also 10.6% higher than the same time frame last year when the median sale price was $495,000. 93 homes were listed in November, which was 36% less than the 145 homes listed in October, and 25% less than the 124 reported as being listed in November of 2018.

Insights: The market is back...up 6.3% from last November...OK, hold on, maybe that isn’t exactly the case. However, depending on where you get your real estate news, that may be what you have heard. While a 6.3% increase in the average sale price is a positive sign, we have to look at this figure in context. If instead it was reported that the average price was actually down .71% from September, down 4.67% from May’s average, and down 2.83% from the average sale price 15 months ago in September of 2018, all of which are accurate, your opinion of the current state of the market may be significantly different than just hearing that the average home price is up 6.3%. Statistics can certainly be misleading, and a single month certainly doesn’t make a market. The reality is last November’s average price was an outlier, the lowest monthly average since January of 2018, $26,850 below October 2018’s average, and $42,656 below December 2018’s average. This is why it is so important to look at the bigger picture and the stats that are being reported in the context of the market. With that out of the way here comes the clip that hasn’t changed for a number of months now in this section: “The average home price continues to be fairly range-bound, a trend that has persisted since early 2018, coinciding with a time period when we started to really notice a decrease in sales volume. Over the past 20 months or so, this range-bound average price has fluctuated between a low of $532,299 (November 2018) and a high of $593,326 (May 2019). It seems it is a few months up, a few months down, as the market has failed to gain any significant traction one way or another. This is consistent with the notion that we are trending towards a more balanced market, and the market is in a bit of a consolidation pattern after a few years of sustained upward pressure on pricing.”

For much of the year, subdued sales volume has been a leading story. November bucked this trend with nearly 32% more sales occurring than we saw a year ago, also representing a slight increase from October of this year. While a positive sign heading into next year, it is important to remember that a single month does not make a market. What will be important is to keep a close eye on the volume stats over the next few months as we emerge from the winter slowdown and into the traditionally busier spring market. Looking at the past 12 months, sales volume is down 14% from the preceding 12-month period, and down 9% year-to-date. 

Single-family homes are not the only category feeling the slowdown...On a trailing-12 basis, acreage sales are down 11%, apartment sales are down 26%, patio homes are down 18%, townhomes are down 5%, half duplexes are down 21%, mobile homes are down 17%. 

However there was some improvement overall with these numbers, and apartment-style condos also had a good showing from a volume perspective in November, with 42% more units selling than in November of last year, and the highest number of condo sales in the past five Novembers. Again, what is important to monitor here is the follow-through in the coming months.

Another interesting observation where we have had a bit of follow-through (at least for the second month in a row) is in the slowdown in the number of new listings. Last month we reported the number of homes listed was down just shy of 28% from the number of homes listed the previous October and November followed through on this with 25% fewer homes listed than in November of last year. So while the pundits are quick to point out that the market has cooled due to government intervention (stress tests, speculation tax, foreign buyer tax), essentially implying that the slowdown is due to subdued demand, what about the supply side? What is interesting is that year-to-date the number of listings is down 9%, which mirrors the decline in sales volume year-to-date which also comes in at 9%. If there is actually something to this, possibly a more reasonable explanation of the slowdown would be a combination of government intervention reducing both overall demand as well as the demand at higher price points based on the stress tests reducing qualifying amounts, meanwhile the supply side is experiencing an insufficient number of homes coming to market to meet the demands of the buyers that are still in the market at the price points that they are looking to buy. We are not talking about the higher end of the market here where there certainly is some excess supply. With both subdued demand and supply, volume has dropped and average prices have stayed relatively flat for the better part of the past year and a half. As we have commented before, the Nanaimo area so far has fared quite well relative to other markets across the province and country since the beginning of 2016. If the supply shortage at low to mid-tier price points is playing a more significant role in the slowdown than has been widely recognized, a resurgent demand without increased supply would set the stage for upward pressure on pricing. Again, important to wait and see on follow through.

Something we have been keeping a close eye on now for a number of months is the sales volume at the higher end of the market. So far there are 6 registered sales of homes over $800k in Nanaimo, including 2 over $1,000,000. With 108 homes currently on the market priced at $800k plus, this would equate to 18 months' worth of supply. 

So how did Nanaimo stack up against other Island communities north of Victoria for the month of November? Looking at the average price, Nanaimo up 6% year-over-year was eclipsed to the upside by Parksville/Qualicum up 7%, Cowichan Valley up 10%, Comox Valley up 12%, and Campbell River up 13% from November of 2018. To the downside, Port Alberni/Westcoast saw average sales prices fall 5% from November 2018’s average. 

Looking at sales volume, Nanaimo up 42% led the way, followed by Parksville/Qualicum up 21%, Campbell River up 10%, and Comox Valley up 2%. To the downside, Port Alberni/West Coast was down 27%, while the Cowichan Valley was down 36%. 

Looking at the entire Vancouver Island Real Estate Board totals, the average sale price was up 9% while sales volume rose 3% from November of 2018. With improving market conditions on the Lower Mainland and volume and price increases in both Nanaimo and Parksville/Qualicum, we will be keeping a close eye on Central Vancouver Island conditions heading into next year, as a strengthening Lower Mainland market would likely be a catalyst for resurgent demand from empty-nesters looking to retire on the Island. 

Strength of the Trend

Factors we also look at when analyzing a market to validate its strength are sell/list ratio; sell price; days to sell, and current inventory numbers:

The sell/list ratio increased to 108% in November, up from 67% in October, and up 77% from November of 2019 when the ratio was 61%. 

The average sell price/list price was 97% in November, up from 96% in October, but down from November of last year when it was 98%. 

The average days on the market for the homes that did sell in November decreased by 8.3% to 33 days from October’s 36 days, which is 22.2% higher than November of last year when days on market averaged at 27.

As of the end of November, the number of active listings was 271, down 21.5% from October’s 345 active listings, and 13.4% lower than the same time last year when there were 313 active listings at month-end.

Insights: Of the 8 market indicators we look at in this section, 6 improved, while 2 deteriorated.

The sell/list ratio of 108% is the obvious number that jumps off the page in this section. The lower volume of new listings and higher sales volume makes this figure more pronounced. While we don’t read too much into a single month's results, we’ll be keeping an eye on this, as a few months of high sell/list and we’ll be working through the active inventory, setting the stage for upward pressure on pricing.  

The average sell/list price has moved downward from the 99% - 100% we were seeing pretty consistently at the peak of this market cycle, however by historical standards 97% is still quite respectable. With an average days-on-market (DOM) of 33 days, the homes that are selling on average are taking longer to sell than they were a couple of years ago when averages dipped down into the teens, but again, by historical standards, 33 days is still quite solid. 

Top Performing Neighbourhoods & Categories

12 of the 18 sub-areas defined by the real estate board in Nanaimo saw an increase in the average selling price (trailing 12 months) from October to November, with 11 of the 18 also experiencing increased prices year-over-year. When looking at these neighbourhood figures, it is important to note that we use trailing 12-month figures to limit volatility caused by lower transaction volumes in some neighbourhoods, where a few high priced or low priced transactions could tremendously skew results. A trailing 12 figure will always be slower to react than simple month-over-month, so that is why the results here are not going to be as pronounced as the figures used in the stats we report above. Moving on, these year-over-year average price changes range from -11.37% in North Jinglepot to 11.58% in Hammond Bay.  For the second month in a row, the top riser month-over-month was Extension with Lower Lantzville once again the second highest. Top performers year-over-year were Hammond Bay, South Jinglepot, South Nanaimo, Extension, and Upper Lantzville. Looking at volume, 9 of the 18 sub-areas saw increases month-over-month with South Jinglepot coming in as the top riser, while only Pleasant Valley and Departure Bay saw increases year-over-year.

Insights: Difficult to draw any significant conclusions here. Some neighbourhoods are up, some are down, with seemingly no particular rhyme or reason. This raises an important point...Not all neighbourhoods and classes of real estate move up and down at the same rate throughout the cycle. If you are considering a purchase that extends beyond the lifestyle considerations of a principal residence, at this stage in the cycle working with a realtor that has a good pulse on neighbourhood profiles and historic market action is very important. 

Single-family homes, waterfront homes (on low volume), and apartment-style condos were the categories that saw an increase in average sale price from October to November, with those same categories also experiencing increases from November of last year. Month-over-month increases in sales volume were reported in single-family homes and, on lower volume, waterfront homes, patio homes, and lots, while single-family homes, waterfront homes, apartment-style condos, and patio homes also experienced year-over-year increases.

Insights:  Again, not much for meaningful conclusions to be drawn as these figures continue to fluctuate from month to month. While we are seeing some improvements, categorically there are not really any trends or patterns that have been confirmed. At this stage we see the market remaining in more of a consolidation phase, which has started to show possible indications of improving conditions. Stay tuned.  

Opportunities

For the better part of the last 2 years, we have witnessed the overall market cool to some degree, as we witness more balanced market conditions than we experienced in the preceding 3 years (2015-2017).

However, it is important to point out that even within the same geographic market (eg. Nanaimo) different categories of real estate and different price ranges can certainly experience quite different market conditions, as the supply and demand factors influencing the categories and price levels are quite different. For example, in these late stages of 2019, the single-family home market continues to be the tale of 2 markets where we don’t have enough quality homes at affordable prices to satisfy the demand at lower price points, and we have an oversupply (equivalent to 1.5 years' worth) in the $800k+ category. 

What does this mean for buyers? Well, as long as inventory levels remain elevated at higher price points, at some stage motivated sellers are going to adjust their pricing expectations to secure a sale. As Days on Market (DOM) add up for a listing, with each passing day, the likelihood of price reductions or concessions increases if the sellers have some motivation. If you are in the market for and looking in the $700-$800k+ range, some patience, as well as diligence in trying to find signs of motivation (price drops, vacant homes, etc.), could go a long way in securing a solid purchase as price levels fall below where they may have been 2 years ago at the peak of the frothiness. 

For sellers, given the lack of quality homes below $700k, if you are thinking about listing, as long as you are priced correctly, you should be well-positioned to sell into fairly strong demand, especially with the right marketing plan maximizing exposure. Depending on your circumstances, if you do not require an immediate move, you are likely best at this stage waiting until the New Year to avoid the holiday slowdown in buyer traffic.

This point takes us back to opportunities for buyers. Because buyer activity nearly dries up for the holiday season, many sellers may take their homes off the market with plans to re-list in the New Year. In fact, some may have already done so. When looking, if days on market are adding up and a home remains on the market through the holiday season, it may be a sign of a motivated seller. In fact, we have used these signals to identify some great buying opportunities for our clients in the past, and will, of course, be looking for these opportunities again this year.

For investors, on the buy side, patience is going to be rewarded. If you are considering an income property, our take is that if you can find an opportunity where the numbers work, eg. positive cash flow, it is worth exploring. If your strategy is to gamble on increasing values, you may be taking on unnecessary risk exposure entering the market at this time if it is a negative cash flow property, as the only guarantee you will have is that you will be paying money out each month until rent levels rise. With increasing rental supply locally, it would be reasonable to expect that you won’t be seeing rent levels increasing at the levels they previously were any time soon.  While we understand over time real estate generally appreciates, timing plays a significant role in investment returns, so just be cautious and make sure you are working with a qualified realtor who understands investment real estate and can give you the information you need (both positive and negative) to make smart decisions. 

Remember, over time real estate generally appreciates. We just know there are peaks and valleys. Buy on the way to the peak and you are positioning yourself for success, buy on the way to the valley, not so much, at least in a short-to-medium timeframe. It is our mandate to provide you with information that you can use to determine which side of the peak we are on, and ultimately to help you make informed decisions that you will not regret. 

For a consultation specific to your situation, or if you have any questions about market conditions, please contact us at info@jahelkagroup.com and we would be happy to help.

Check out the Nanaimo Market Statistics Here:  Market Stats November 2019

Source: VIREB

Nov. 7, 2019

Nanaimo Market Statistics October 2019


October Market Conditions Continue to Reflect a More Balanced Market


Single Family Prices and Volume

97 single-family homes sold in October, 6 more than the 91 that sold in September, and 24 fewer than what sold in October of last year. The average home price was down just over 2% in October to $556,717 from September’s average of $569,667 and this figure was 0.43% lower than reported last October when the average home price was $559,149. The median sale price increased marginally from $539,000 in September to  $539,500 in October, which is also almost 3% higher than the same time frame last year when the median sale price was $525,000. 145 homes were listed in October, which was 23% less than the 188 homes listed in September, and almost 28% less than the 201 reported as being listed in October of 2018.

Insights: The average home price continues to be fairly range-bound, a trend that has persisted since early 2018, coinciding with a time period when we started to really notice a decrease in sales volume. Over the past 20 months or so, this range-bound average price has fluctuated between a low of $532,299 (November 2018) and a high of $593,326 (May 2019). It seems it is a few months up, a few months down, as the market has failed to gain any significant traction one way or another. This is consistent with the notion that we are trending towards a more balanced market, and the market is in a bit of a consolidation pattern after a few years of sustained upward pressure on pricing. 

Low sales volume continues to be the major story heading into the last couple of months of 2019. October sales volume was down 20% over the same month last year, consistent with the 19% decrease in sales volume over the preceding 12 months, which in itself was down 6.2% from the 12 months before that. In other words, volume has been on the decline for the past couple of years.  Single-family homes are not the only category feeling the slowdown...On a trailing-12 basis, acreage sales are down 24%, apartment sales are down 29%, patio homes are down 18%, townhomes are down 7%, half duplexes are down 20%, mobile homes are down 18%. 

Something that is interesting to note is that while sales volume is down 20%, the number of homes listed was down just shy of 28% from the number of homes listed in October of last year. So while the pundits are quick to point out that the market has cooled due to government intervention (stress tests, speculation tax, foreign buyer tax), essentially implying that the slowdown is due to subdued demand, what about the supply side? As we’ve highlighted throughout this year, sales volume at the higher end of the market is quite light, so possibly a more reasonable explanation of the slowdown would be a combination of government intervention reducing both overall demand as well as the demand at higher price points based on the stress tests reducing qualifying amounts, meanwhile the supply side is experiencing an insufficient number of homes coming to market to meet the demands of the buyers that are still in the market at the price points that they are looking to buy. What has resulted is a market with both subdued demand and supply, whereby volume has dropped and average prices have stayed relatively flat for the better part of the past year and a half. As we have commented before, the Nanaimo area so far has fared quite well relative to other markets across the province and country since the beginning of 2016. 

So with single-family down 19% and 12% on a trailing 12 month and year to date basis, respectively, you may be wondering how does this decreased volume compare to other categories of residential real estate? Here are the trailing 12 and year-to-date  figures: Apartment style condo volume is -29% / -21%, patio homes are -19% / -23%, and townhomes are -7% / +2%. The category that is a bit surprising is lots, which are up 53% / 50%. 

Something we have been keeping a close eye on now for a number of months is the sales volume at the higher end of the market. So far there are 9 registered sales of homes over $800k in Nanaimo, including 3 over $1,000,000.  

With 111 homes currently on the market priced at $800k plus, this would equate to more than a year’s worth of supply. However, if you have been following our commentary throughout the year, you may remember us reporting months of supply figures significantly more than just over 12 months, so on its own that could be taken as a positive. I’d suggest the declining months of supply is more a reflection of people who have had their homes sitting idle on the market deciding to take their homes off the market to ride out the winter. In October 12 listings priced above $800,000 were cancelled, and 15 expired, which essentially explains why the active inventory number, and subsequently the implied months of supply figure, have dropped. 

So how did Nanaimo stack up against other Island communities north of Victoria for the month of September? Looking at the average price, Nanaimo, down just slightly (0.43%) year-over-year, was eclipsed to the downside by the Cowichan Valley, down 3%, and Parksville/Qualicum down a more noticeable 12% from October of 2018. To the upside, Port Alberni/Westcoast led the way, up 15% over October of 2018, with the Comox Valley (up 10%) and  Campbell River (up 7%), also showing some strength. 

Looking at sales volume, Nanaimo declining 20% didn’t see quite the volume slowdown that Campbell River did, down 26%. Other markets seeing decreased volume in comparison to the same time period last year were Parksville/Qualicum down 9% and Port Alberni/West Coast down 5%. The Comox Valley saw sales volume rise by 17% over October 2018, while volume in the Cowichan Valley was up a more modest 6%. 

Looking at the entire Vancouver Island Real Estate Board totals, the average sale price was up 3% while volume was down 11% from October of 2018.

Strength of the Trend

Factors we also look at when analyzing a market to validate its strength are sell/list ratio; sell price; days to sell, and current inventory numbers:

The sell/list ratio increased to 67% in October up from 48% in September, and up almost 12% from October of 2018 when the ratio was 60%. 

The average sell price/list price remained constant at 96% in October, down from 97% in October of last year. 

The average days on the market for the homes that did sell in October increased by 6% to 36 days from September’s 34 days, which is 16% higher than October of last year when days on market averaged at 31.

As of the end of October, the number of active listings was 345, down 7.5% from September’s 373 active listings, but 3% higher than the same time last year when there were 335 active listings at month-end.

Insights: Consistent with more balanced market conditions, of the 8 market indicators we look at in this section, 3 were positive, 4 were negative, and one remained unchanged. 

On its own, a sell/list price of 67% is more reflective of a seller’s market, however, the other stats don’t appear to support this sentiment. This figure is more reflective of the declining number of homes being listed relative to past years.

The average sell/list price has moved downward from the 99% - 100% we were seeing pretty consistently at the peak of this market cycle, however by historical standards 96% is still quite respectable. With an average days-on-market (DOM) of 36 days, the homes that are selling on average are taking longer to sell than they were a couple of years ago when averages dipped down into the teens, but again, by historical standards, 36 days is still quite solid. 

Top Performing Neighbourhoods & Categories

10 of the 18 sub-areas defined by the real estate board in Nanaimo saw an increase in the average selling price (trailing 12 months) from September to October, with 8 of the 18 also experiencing increased prices year-over-year. When looking at these neighbourhood figures, it is important to note that we use trailing 12-month figures to limit volatility caused by lower transaction volumes in some neighbourhoods, where a few high priced or low priced transactions could tremendously skew results. A trailing 12 figure will always be slower to react than simple month-over-month, so that is why the results here are not going to be as pronounced as the figures used in the stats we report above. Moving on, these year-over-year average price changes range from -16.28% in Brechin Hill, the bottom performer for the seventh month running, to 13.79% in Hammond Bay.  The top riser month-over-month was Extension with Lower Lantzville the second highest. Top performers year-over-year were Hammond Bay, Diver Lake, Cedar, and South Nanaimo. Looking at volume,  3 of the 18 sub-areas saw increases month-over-month with Extension coming in as the top riser, while only one neighbourhood, (Pleasant Valley), saw increases year-over-year.

Insights: Difficult to draw any significant conclusions here. Some neighbourhoods are up, some are down, with seemingly no particular rhyme or reason. As I had commented on last month, if I had to speculate on why the Brechin Hill neighbourhood has been underperforming, I would suggest it is a neighbourhood that attracts a lot of attention from out-of-town buyers given its close proximity to the seawall, downtown, ferries, and seaplane terminals, as well as offering some pretty exceptional views at an affordable price.  With buyer demand from out-of-town buyers noticeably slower than it was in years past, there simply isn’t the upward pressure on pricing that we were seeing. Brechin Hill also features many older homes that were prime targets for investors looking for a fix-and-flip. With prices essentially flatlining, the risk of not being able to cover renovation costs, let alone make a profit, is simply too high. This raises an important point...Not all neighbourhoods and classes of real estate move up and down at the same rate throughout the cycle. If you are considering a purchase that extends beyond the lifestyle considerations of a principal residence, at this stage in the cycle working with a realtor that has a good pulse on neighbourhood profiles and historic market action is very important. 

Waterfront homes (on low volume), patio homes, and townhouses were the categories that saw an increase in average sale price from September to October, with waterfront homes, townhouses, and lots also experiencing increases from October of last year. Month-over-month increases in sales volume were reported in single-family homes, waterfront homes (again on low volume), and apartment-style condos, while lots was the only category to experience year-over-year increases.

Insights:  Again, not much for meaningful conclusions to be drawn as these figures continue to fluctuate from month to month, and categorically there are not really any trends or patterns we are observing, which we interpret as suggesting we are in more of a consolidation phase where the market is taking a breather after a steady run-up. 

Opportunities 

For the past number of months, there has been very little new to report in this section of our recap. From our perspective, we see overall, that so far in 2019 the market has continued to trend towards more balanced market conditions. 

While we don’t have a crystal ball, if you’ve been reading our commentary you will be familiar with our take that in the coming years if inventory levels remain elevated at higher price points, at some stage motivated sellers are going to adjust their pricing expectations to secure a sale. 

This fall we have started to see more and more aggressive price reductions at the higher end of the market, and it appears as though there may be some good deals out there. For information purposes only, I will provide 5 examples, cautioning that these are not recommendations as I have not conducted any investigation or due diligence on these homes, but rather to say that based on the listing information alone, they fit the type of scenario I have been describing, and may warrant further investigation:

MLS # 462135 - 6601 Golden Eagle Way - $699,900 - Originally listed at $749,900

MLS # 460859 - 6-3560 Yellow Point Road - $749,000 - Originally listed at $899,900

MLS # 461997 - 2433 Garry Oak Drive - $879,000 - Originally listed at $955,000

MLS # 456563 - 102 Piper Cres - $1,098,000 - Originally listed at $1,450,000

MLS # 461537 - 5470 Bayshore Drive - $1,199,999 - Originally listed at $1,445,000

Should this trend continue, and depending on how long it lasts, we anticipate that there will be somewhat of a ripple effect, where we could see more value at various price points than we are seeing now. While we don’t foresee average prices correcting much if at all, in the coming year or two, what we do see is that dollars may stretch further and buyers will be able to buy nicer homes at more affordable prices than they can today. 

The true unknown variable here that may lead to this not coming to pass is the unknown future buyer demand at the higher end of the market. We don’t see that the local population has the qualifying incomes to support the absorption of the listings for sale at the higher end of the market, and the volume increase we’d expect in the coming years as aging baby boomers look to downsize. Therefore, market conditions at the higher end of the market are largely dependent on demand from out-of-town buyers, and their demand is largely dependent on the confidence they have to purchase in our market, which is significantly influenced by the market conditions in their own local markets where they are reading the headlines in the newspaper and reported on the local news. The lower mainland market has been showing some signs of life, and continued strength will likely position those looking to exit mainland life with the opportunity to do so, as once again mainland sellers are finding buyers for their homes, which paves the way for them to buy into the Vancouver Island dream at cents on the dollar, relative to home prices in Vancouver.

On that note, where do we see opportunities for buyers? Well looking at single-family homes, for the time being for the few buyers out there looking at higher-end homes, we’d still caution you to take your time as the equivalent of just over a year’s worth of inventory provides you with plenty of choice and likely some negotiating room if you can find a realistic seller.  While undoubtedly the higher end of the market will rebound and regain its upward ascent at some point, as touched on above, until buyers with deep enough pockets to afford the higher-priced homes start to absorb the excess inventory, short term market conditions at the higher end of the market are likely to remain relatively subdued. Until we are reporting otherwise, take your time and be selective, while looking for signs of a motivated seller and you just may find what proves in time to have been a great buy of a higher-end home. 

For sellers, while owners of higher-end homes may have missed the top of this market cycle, life circumstances will continue to drive sellers to list their homes. With an elevated supply of higher-priced listings currently on the market and fewer buyers, it is all the more vital that the home is priced accurately and competitively to maximize exposure when interest is the highest. So if you are listing, selecting a Realtor with a strong marketing platform and an active approach to marketing your home is becoming increasingly important. While we went through a period for the last few years where a For Sale sign and an MLS listing were enough to entice buyers to write an offer (definitely not our approach), in this market that haphazard approach is simply not going to cut it. 

For investors, on the buy side, patience is going to be rewarded. If you are considering an income property, our take is that while you may be able to find the odd diamond in the rough, currently you are still likely best served by looking at other markets or waiting it out as there is no way you are going to cash flow on a leveraged purchase. Given what we have outlined above, at this point in the market cycle, we would not recommend speculating on further price appreciation with a negative cash flow property in this market. For multi-family investors, cap rates are at historic lows and therefore valuations at all-time highs. Factoring in the significant number of purpose-built rental apartment buildings currently in the development permitting or building permitting stage, the increased supply of rental units in the coming years is going to potentially put downward pressure on rental rates, and push up vacancy rates which are already starting to increase. While expectations are that further interest rate hikes are likely on hold for the foreseeable future, rates are still below historic norms, it would be a reasonable assumption that at some point over the next few years we will continue the climb to a more normalized interest rate environment. When that happens, eventually cap rates will likely start to see a similar increase towards more normalized levels. Without the upward pressure on rents, this is setting the stage for decreasing values. We’ve not exactly described the ideal conditions for investment. 

Remember, over time real estate generally appreciates. We just know there are peaks and valleys. Buy on the way to the peak and you are positioning yourself for success, buy on the way to the valley, not so much, at least in a short-to-medium timeframe. It is our mandate to provide you with information that you can use to determine which side of the peak we are on, and ultimately to help you make informed decisions that you will not regret. 

For a consultation specific to your situation, or if you have any questions about market conditions, please contact us at info@jahelkagroup.com and we would be happy to help.

Check out the Nanaimo Market Statistics Here:  Market Statistics October 2019

Source: VIREB