
COVID-19 Continues To Slow Sales Volume in May
The month of May saw us move into Phase 2 of the province’s restart plan which certainly represents a few steps in the right direction for the economy and our sanity, however, the world we knew just a few short months ago still seems like a distant memory. Dating back to the early stages of 2020 before the COVID-19 related economic lockdown, there was reason for optimism in the Nanaimo real estate market. With the gradual re-opening of the economy, there are realtors who are starting to sing a more optimistic tune about Nanaimo’s market conditions, however as much as we hope they are right and COVID-19 is now largely a distant memory and it is upwards and onwards, our outlook remains cautious, as it is our belief that the economic impact of the slowdown will ultimately be significantly greater than many are recognizing and that there is a fairly strong likelihood that much of the economic pain is still to come, even more likely if the second wave materializes some time later this year. While none of us have a crystal ball, and outside of Ottawa, none of us have a money-printing machine to try to counteract natural economic forces, we certainly cannot make any concrete predictions about what is to come. However, we continue to believe that it is important to report on what has occurred in the market and put our best foot forward interpreting how market conditions may (and I caution “may”) shed some light on what may be to come as we collectively try to emerge from this unexpected event.
Single Family Price and Volume
70 single-family homes sold in May, up 27% from the 55 that sold in April, but 49% less than the 136 that sold in May of last year. The average sale price decreased to $578,514, down 2.5% from $593,503 in April and from $593,326 in May of last year. The median sale price decreased by 0.53% from $568,000 in April to $565,000, which is 1.7% less than the same time frame last year when the median sale price was $575,000. 160 homes were listed in May, which was 65% more than the 97 homes listed in April, but 33% less than the 240 listed in May of 2019.
Insights: Despite the number of homes sold increasing from last month, on the heels of April’s 47% decrease in sales volume over April of 2019, May sales volume was down 49%, undoubtedly suggesting the COVID-19 related economic slowdown continued to significantly impact market activity. At the time of writing 8.37 million applicants had submitted 15.32 million applications for CERB Benefits, suggesting a substantial percentage of the working population have had their incomes significantly impacted by the pandemic. While the optimist may be quick to suggest that it was the social distancing measures in place that has continued to slow sales volume, the realist would counter that for most Canadians the purchase of a home isn’t possible without some form of financing, and mortgage qualification requires meeting minimum income requirements and down payment requirements. For those who have lost their job, their income has been reduced, or they have had to eat into their down payment to keep up with mounting bills, if they had intended to purchase in the near future, it is now no longer a possibility. As the weeks tick by and businesses adapt their business models and realize less on-site staff are required or businesses that intended to only close temporarily realize they will be unable to re-open, the likelihood of these layoffs originally intended to be “temporary” becoming permanent only increases. For those folks still working whose income is variable or whose hours have been reduced, you have to think that increased credit utilization to cover the bills is going to impact qualification amounts for those looking to buy in the months and years to come. For all those who were previously subscribing to the “light switch” theory, eg., when the government lifts restrictions this market is going to take off due to all of the pent up demand, we continue to see that as extremely unlikely, as it appears restrictions will be lifted gradually, and the mid-May step into Phase 2 appears to have had a minimal impact on increasing sales volume, relative to April’s numbers where the economy was essentially in full lockdown mode.
What are we getting at? We are not expecting a V-shaped recovery on sales volume. The economy will recover, it always does, but a sustained, well supported economic recovery will take some time. Those who have lost employment need to find new jobs. Those who have spent their down payment or used credit to pay the bills during the slowdown will need to get their financial affairs back in order before heading out house shopping. Looking at the last market cycle, in 2007, the year preceding the 2008 Financial Crisis, Nanaimo had 1702 single family homes sell. In 2008, sales volume dropped to 1174, representing a 31% decline. Over the next 5 years, the market remained subdued, averaging 1136 sales as our local economy slowly recovered and rebuilt, setting the stage for the 2014-2017 major run-up in sales volume and average sale prices. What happened to prices over that 5 year period (2009 - 2013) you ask? At an average of $356,722 the average sale price was actually lower than the average of $363,985 which was the cycle high in 2008, the year following the sales volume cycle high.
But that was then, and this is now, what is happening and what do you see happening with average prices moving forward? Since reaching the all-time high average price for Nanaimo in January of this year (on lower volume) at $603,720, the average price has declined 4.2%. Had it not been for COVID, we wouldn’t have read much into this fluctuation, as for the past 2 years after the strong run-up in the years that preceded it, the average price had largely been range-bound between $550k - $600k. However, we have to wonder if this could possibly be the first stage of a larger move downwards, driven by reduced buyer demand based on fewer financial qualifications and a more cautious stance prioritizing saving overspending. Economic confidence has certainly been shaken, for some more than others, and only time will tell how long it will take to rebuild.
The other important consideration is that you can’t look at the market categorically - whether that be by asset class, such as “single-family homes”, geographically, such as the “Nanaimo market”, and paint the picture with broad strokes. There are categories within categories. Our group had been involved in possibly more multiple-offer situations than not on a variety of asset classes with listings priced under $600,000. Why is this? Demand remains strong for solid options priced below $600,000 because this is what the majority of the population of Nanaimo can afford. We continue to believe that for the foreseeable future, the higher end of the market at large will continue to face headwinds due to an oversupply and lack of demand. When will this change? When we have sustained out-of-town buying where buyers have the financial means to sustainably absorb the volume of higher-priced homes that the downsizing baby boomers are hoping to unload.
So how exactly does this project moving forward? While there are so many variables at work here, it is difficult to predict, looking at factors impacting supply and demand as touched on above is likely a good place to start in trying to formulate an idea of how pricing may be impacted. From a demand perspective, ask yourself, are we more likely to have more demand or less demand whenever the current situation ends? Remember, real estate trading services were deemed an essential service, so all those who were extremely motivated and qualified to buy have been doing so. From our perspective, the longer this drags out, the more jobs that are lost and businesses that see their temporary closures become permanent closures, the more people who eat into their down payment funds just to pay the bills, the more credit is utilized, all of this points to reduced buyer demand. If there are not enough buyers for the volume of homes for sale (which could very well increase substantially with so many intending to sell holding off), that is when we start to see motivated sellers start to drop their prices, and prices will ultimately adjust until they reach the point of equilibrium where demand equals supply. From the supply side, ask yourself the same question? Are we likely to have more supply or less supply a number of months from now? The difference between demand and supply is that despite intentions, demand can be eliminated beyond the control of the intended buyer due to factors such as job loss or a reduction of downpayment. The supply side is not affected in such a way. If a seller wants to sell, they can list their property. Fear of declining values in the future or reports of declining values (if this does occur) may prompt owners to list, increasing supply. Supply and demand considerations are certainly something we’ll be monitoring closely, and we will be doing so not just considering the overall market, but demand and supply at different price points, in different neighbourhoods, and for different categories of real estate.
Other Island Communities - Single Family Price and Volume
So how did Nanaimo stack up against other Island communities north of Victoria for the month of May? Looking at the average price of a single-family home, Nanaimo was actually the only area that saw a reduction in the average single-family home price to the tune of -2%, with all other communities experiencing increases: Cowichan Valley up 5%, Port Alberni/West Coast and Comox Valley both up 7% year-over-year, Campbell River up 9%, and Parksville/Qualicum seeing the highest increase at 18%.
Looking at sales volume in comparison to last May, once again, all communities experienced reductions in volume: Cowichan Valley saw the lowest decline at -5% while all other areas saw more substantial decreases, Port Alberni/West Coast -37%, Nanaimo -49%, Comox Valley -57%, Parksville/Qualicum -59%, and Campbell River experiencing the steepest decline, down 62%.
Looking at the entire Vancouver Island Real Estate Board totals, the average sale price increased 5%, and sales volume overall declined by 46% from May of 2019.
Insights: The increasing average prices outside of Nanaimo are certainly positive, however, it is somewhat tempered by the significant decrease in volume. Parksville/Qualicum is an interesting example with average sales prices up 18% over last May, but sales volume down 59% compared to the same period. Outside of Nanaimo, Parksville/Qualicum is the market we watch closest, followed by the Cowichan Valley, as many of our out-of-town buyers see their original search parameters stretch from Qualicum Beach south to the Cowichan Valley, and Parksville Qualicum as Canada’s premier retirement destination serves as somewhat of an informal gauge on demand for lifestyle moves to the Island. The average price increase is certainly viewed positively, the volume decreases not so much… With this being the case, we will be continuing to monitor this market closely in the months to come and continue to report on possible implications for our market based on out-of-town buyer demand.
Strength of the Trend
Factors we also look at when analyzing a market to validate its strength are the sell/list ratio; sell price; days to sell, and current inventory numbers:
The sell/list ratio decreased to 44% in May, down from 57% both last month and in May of 2019.
The average sell price/list price was 98% in May, up 1% from April but no change from the same time frame last year.
The average days on the market for the homes that did sell in May was 26 days, up 8% from both last month and May of last year when the average days on market was 24.
As of the end of May, the number of active listings was 311, up 14% from April’s 272 active listings, but 18% lower than the same time last year when there were 381 active listings at month-end.
Insights: Of the 8 market indicators we look at in this section, 5 deteriorated, 2 improved, and 1 remained unchanged.
The sell/list ratio decreased to 44%, which all else considered equal is a reasonable figure. However, this is the lowest we have seen in 4 months, and the bigger question, similar to average prices, is whether this is the first step in a more significant move downwards? The number of new listings was down 33% over last May, not as pronounced as the 47% decrease in April over April of 2019. Assuming COVID restrictions continue to lift, what is important to remember is that financial challenges or even distress will not prevent people from listing, in fact, it may drive people to list their homes. Financial challenges will however prevent people from qualifying for mortgages or limit their qualification amounts if they do. Translation - it is a very real possibility that we see the sell/list ratio continue to decline, which will serve as an indicator that there is downward pressure on pricing, at least in some price ranges or categories.
The sell price to list price ticked up 1 point from last month, while holding steady from last May at 98%. Not much to comment on here, other than to say that this only factors in the homes that sold, not the 311 active listings on the market at month’s end that hadn’t yet sold. 98% is a solid number, but it is important to remember that it doesn’t factor in sellers factoring in a possible COVID impact to their list price, or the price reductions that preceded the offer, as this figure is based on the last listed price before the offer.
By historical standards, average days on the market of 26 days is still quite low. While this does only factor in the homes that sold, it suggests that attractive offerings that are priced right are still selling quickly in many cases, especially at the lower end of the market. This is consistent with our team’s experience of having been in numerous multiple offer situations for newly listed homes over the past few months, despite the COVID precautions and concerns.
Lastly, the 311 homes on the market at the end of the month was up from last month’s ending inventory of 272. Will we see the number of homes continue to climb? Only time will tell, but if we had to make a call, we would suggest, “yes”. While there were 70 fewer homes on the market than at the end of May 2019, there were also 80 fewer new listings. While currently there is less supply, there is also less demand. With the economy starting, we will be monitoring inventory numbers closely. For buyers hoping for a “good deal”, you should be hoping for lots of new listings and lower buyer demand. For sellers hoping the impact on home values is minimal, you should be hoping that most who had intended to list hold off and that both supply and demand begin to increase at a relatively similar pace. This may be the more optimistic outlook, but given the innumerable variables here and the unprecedented level of government intervention, you never know...
Top Performing Neighbourhoods & Categories
7 of the 18 sub-areas defined by the real estate board in Nanaimo saw an increase in the average selling price (trailing 12 months) from April to May, with 12 of the 18 also experiencing increased prices year-over-year. When looking at these neighbourhood figures, it is important to note that we use trailing 12-month figures to limit volatility caused by lower transaction volumes in some neighbourhoods, where a few high priced or low priced transactions could tremendously skew results. A trailing 12 figure will always be slower to react than simple month-over-month, so that is why the results here are not going to be as pronounced as the figures used in the stats we report above.
Moving on, these year-over-year average price changes range from -14.87% in North Jinglepot to 24.42% in Extension. The top risers month-over-month were Extension, South Jingle Pot, and Brechin Hill. Top performers year-over-year were Extension, Upper Lantzville, Cedar, Uplands, and Lower Lantzville. Looking at volume, only 2 of the 18 sub-areas saw increases month-over-month, Lower Lantzville at 11.1% and South Jingle Pot at 8.7%, while 4 of the 18 sub-areas also saw increases year-over-year on a trailing-12 month basis, with the University District the top riser in this respect.
Insights: The only noticeable trend is that most of the top-performing sub-areas here for both price and volume are located towards the outskirts of town. The Extension area for the second month in a row leading the way with price increases both month-over-month and year-over-year is a prime example and may indicate that there are some buyers seeking larger properties. It is likely too early to suggest that increased demand for larger properties is resulting from more people exiting the urban life and social distancing considerations, but stay tuned, this will become a talking point in the industry in months to come. Another possible explanation for Extension’s average price increases is that as a historically more affordable area, it may be benefiting from demand from those priced out of other neighbourhoods. Upper Lantzville, Lower Lantzville, and Cedar are other top performers where larger properties are more common. Lantzville (Upper and Lower) is often high on the wishlist of buyers’ preferred areas, especially out-of-town buyers. As expected given overall market figures, volume was down for the vast majority of sub-areas.
Single-family water homes and lots (on low volume - 2 and 1 respectively) and apartment-style condos were the only categories that saw an increase in average sale price from April to May, with single-family water homes and lots the only categories to see increases year-over-year. Single-family homes and lots were the only categories that did not report month-over-month increases in sales volume, with no categories posting year-over-year increases.
Insights: The low volume of waterfront homes and lots sold above essentially render these monthly average pricing figures useless. In case you are interested in the impact on sales volume for the various categories, in comparison to last May, sales volume was down 90% for lots, 75% for waterfront homes, 60% for townhomes, 56% for patio homes, and 21% for condos.
Opportunities
As the economy begins to emerge from the nightmare that was COVID-19, undoubtedly prospective Buyers and Sellers will have questions about what it means for them. Is now a good time to buy? Is now a good time to sell? The reality is there are no broad strokes answers to this, as any generalizations would be foolish. More so than ever, it is really dependent on what you are looking to buy or sell, where it is, what price range, etc. All of the data provided earlier in this report is based on amalgamated data provided by the real estate board for the single-family homes category in Nanaimo, and while it provides a general idea of how the market is performing, it certainly doesn’t tell the whole story. In the interest of your time, we will take a quick look below at this category that we focus most on in our monthly recap - single-family homes - to support this assertion. While we are looking at 1 category - single family, in a single geographic location - Nanaimo, you will see that there are huge variances in market conditions and market action in different price ranges. You could do a similar micro-analysis of neighbourhoods, communities, style of homes, age of homes, the list goes on and on. The important thing to note is that you can’t rely on the headlines or averages as a credible source to make decisions. You need to dig further. As we emerge from this economic shock, if you are considering listing or purchasing, please make sure you are working with a Realtor that has the knowledge and expertise to navigate the market and understands market conditions for the specific category of real estate you are looking to transact in.
Here we go... Let’s first take a look at the active inventory of single-family homes broken down by price category and proportionate share of listings within these categories versus the proportionate share of sales that occurred in May within these categories.
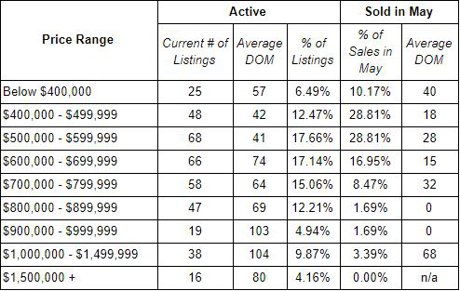
As you can see, below $600,000 the % of sales in May exceeds the % of listings, between $400k - $600k by a fairly significant margin. The relationship then reverses significantly as prices climb. You will also see looking at active inventory figures that the average Days on Market (DOM) follows a general trend upwards as price increases, suggesting higher price homes are sitting longer on the market. Hold on you say, what about the $800k - $900k range where the average days on market for homes sold in May was zero. That is correct, 1 standout home sold in each category the first day it was listed. There are currently 68 homes on the market in this range, the 2 sales in May imply that at that level of absorption, we currently have nearly 3 years of supply in this range. In other words, if sales were to continue at this pace, it would take nearly 3 years for all of these homes to sell, and that is not factoring in any new listings being added to the equation during this period. Compare this to the $400k - $500k range, where there is currently less than 3 months of supply, and you can see that we are talking about drastically different market conditions depending on the range you are looking to sell or buy in.
A couple of other surprising statistics about May sales. Firstly, 39% of homes sold at or above the list price. Secondly, 41% of homes that did sell, sold within the first week of being listed (or re-listed). The takeaway here is that quality homes that are accurately priced (mostly below $600k), are still moving quickly and there likely won’t be much room for negotiation. Conversely, the 2 homes that sold above $1,000,000 in May sold for 92% and 95% of the asking price, after 58 and 78 days on the market.
What does all this mean? So far, we are still in very much of a micro-market, where certain pockets of the market could be described as hot, and some could be described as cold. Hot pockets are good for sellers, cold pockets are good for buyers.
Due to the demographics of the local population, we continue to believe that homes under $600k and suited homes under $700k are well-positioned to weather the COVID-19 related storm much better than homes priced higher, where there is such a small percentage of our population that have the qualifying income to afford these higher-priced homes. These homes also appear to represent good value to lower mainland based buyers, who continue to add strength to the underlying demand. While there is always the macro-market effect, where the overall real estate market on a larger scale, such as BC, or even Canada will be impacted by various factors such as monetary and fiscal policy, government intervention, etc., we don’t see the values of homes at the mid to lower end of the market being impacted too significantly at this stage. Of course, this is subject to change as we continue to monitor the market. If COVID-19 comes back for a second and third wave and 2 years from now we are still looking at significant unemployment numbers and a weak economic picture, our outlook would likely be more cautious for this category.
The $700k range is largely transitionary, and attractive listings are still selling. Above $800k our outlook isn’t so rosy. Nealy ⅓ of the homes listed in Nanaimo are priced above $800k, yet less than 7% of homes sold in May sold above $800k. While the most attractive options are still selling, eg. the 2 in May that sold the first day on the market, the vast majority of homes in this range are not selling. Eventually, this leads to price concessions, eg. the 92% and 95% of list price sales on the 2 homes over $1,000,000.
For buyers, as inventory levels mount in the $800k+ range, we see that opportunities are starting to and will continue to emerge, until which time sustained demand emerges for homes in this price range. For buyers waiting for a good deal on homes under $600k and suited homes under $700k, you may be waiting a long time, in fact, we see a very real possibility that you won’t see better value in this price range than we have today, there is simply too much competition driven by household income and financing qualification restrictions of the local population.
For sellers, if you have a home under $600k or suited homes under $700k and you need to sell, you are in a good position to attract a buyer if you need to exit. At higher price points, if you have an exceptional offering and need to exit, you have a chance. Otherwise, if time is on your side, you may be best served by waiting on the sidelines for more robust buyer demand in your price range. The challenge here is timing, as we don’t know how long it will take for conditions to improve. What we do know is historically markets are cyclical and there will likely be a better time to exit ahead, it could just be 2, 3, 5, 10 years out. Sellers also need to factor in their next move to the equation. If you are looking to sell your $800,000, 3,000+ sqft. home to buy a ground-level, seniors oriented home in the $500k - $600k range, then you may want to consider pulling the trigger, as demographic driven demand for those types of homes from those across Canada choosing Central Vancouver Island as their retirement destination of choice may put significant upward pressure on prices for that type of home, which could negate any potential benefit of holding off on selling until market conditions are stronger at higher price points. Again, generalizations are as good as useless. Working with a realtor taking an advisory approach and focusing on lifestyle by design will go a long way in helping you determine the best way to achieve your real estate related goals.
For investors, with us, it always gets back to the numbers. Downside protection is every bit as important as speculating on appreciation. Values so far have not been significantly impacted, especially at the lower end of the market. With much uncertainty persisting, purchasing right now represents increased risk that you could find yourself in a situation in the coming months with a property that has a value lower than when you purchased it. This makes it more important than ever that any investments are cash flow positive and achieve an acceptable rate of return because if you acquire a negative cash flow property, your only guarantee in the short-run is the property will be costing you money. With an increased probability of values declining, buying a property that is costing you money each month, and has a decent chance of losing value (at least short term) doesn’t seem like an overly prudent investment approach. However, if you do come across an investment opportunity where the numbers do work well and you are a long-term investor and are comfortable assuming the risks that in the short term there is a reasonable probability we will see average home values fall, then maybe you don’t want to rule out a purchase this year. The reality, unfortunately, is that mass economic slowdowns create financial hardship, which inevitably at some stage will likely result in some good buying opportunities for those watching closely. While we don’t have a crystal ball, it is our take that things are likely to get worse before they get better, especially if the COVID-19 concerns linger longer than expected, or we have a second wave heading into fall and winter as is increasingly being prepared for. We believe on the buy side, patience is likely going to be rewarded. Remember, much of your ultimate return is derived from your entry point, the price you were able to purchase at. Right now sub-$700k, most homes are still being listed at all-time highs. So, for most investors, stay safe, educate yourself on the local market, be patient, watch out for deals if and when they emerge, make sure you are running the numbers, and if the numbers work, be ready to act. In this regard, don’t feel shy to reach out and get the conversation going with a good investment-focused realtor. They are here to help.
Remember, over time real estate generally appreciates. We just know there are peaks and valleys. Buy on the way to the peak and you are positioning yourself for success, buy on the way to the valley, not so much, at least in a short-to-medium timeframe. Right now we have reason to believe we may be more likely on the way to a valley or stuck in the valley, than on an upward ascent to the peak, but only time will tell. It is our mandate to provide you with information that you can use to determine which side of the peak we are on, and ultimately to help you make informed decisions that you will not regret.
Above all else, stay safe, do your part in flattening the curve, and we wish you and all those close to you the best of health!
For a consultation specific to your situation, or if you have any questions about market conditions, please contact us at info@jahelkagroup.com and we would be happy to help.
Check out the Nanaimo Market Statistics Here: Market Stats May 2020
Source: VIREB
Disclaimer: The information presented is intended for general information purposes only and should not be construed as Real Estate advice. Each client's situation is unique and therefore we recommend consulting directly with your professional advisors (Realtor, Accountant, Lawyer, Investment Advisor, etc.) prior to making any real estate decisions. Not intended to induce breach of an existing agency agreement or solicit properties currently listed for sale or individuals currently under contract with a Brokerage.